Cajun vs Korean Seniors Poverty Over the Age of 65
COMPARE
Cajun
Korean
Seniors Poverty Over the Age of 65
Seniors Poverty Over the Age of 65 Comparison
Cajuns
Koreans
11.9%
SENIORS POVERTY OVER THE AGE OF 65
2.0/ 100
METRIC RATING
231st/ 347
METRIC RANK
10.1%
SENIORS POVERTY OVER THE AGE OF 65
97.4/ 100
METRIC RATING
80th/ 347
METRIC RANK
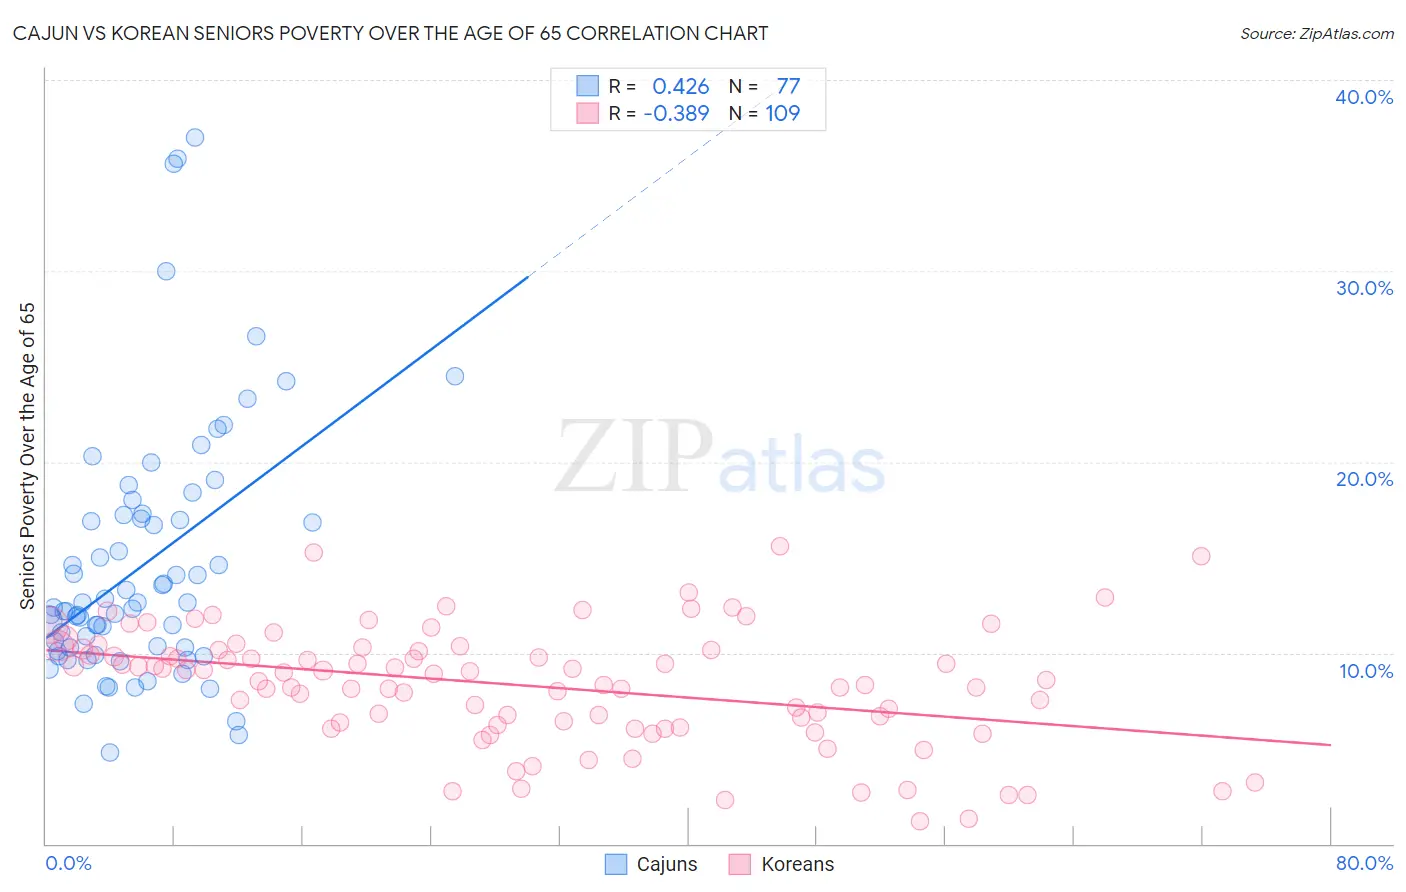
Cajun vs Korean Seniors Poverty Over the Age of 65 Correlation Chart
The statistical analysis conducted on geographies consisting of 149,395,455 people shows a moderate positive correlation between the proportion of Cajuns and poverty level among seniors over the age of 65 in the United States with a correlation coefficient (R) of 0.426 and weighted average of 11.9%. Similarly, the statistical analysis conducted on geographies consisting of 507,822,644 people shows a mild negative correlation between the proportion of Koreans and poverty level among seniors over the age of 65 in the United States with a correlation coefficient (R) of -0.389 and weighted average of 10.1%, a difference of 18.1%.
Seniors Poverty Over the Age of 65 Correlation Summary
| Measurement | Cajun | Korean |
| Minimum | 4.8% | 1.2% |
| Maximum | 37.0% | 15.6% |
| Range | 32.2% | 14.4% |
| Mean | 14.5% | 8.3% |
| Median | 12.4% | 8.9% |
| Interquartile 25% (IQ1) | 10.2% | 6.3% |
| Interquartile 75% (IQ3) | 17.1% | 10.2% |
| Interquartile Range (IQR) | 6.9% | 3.9% |
| Standard Deviation (Sample) | 6.6% | 3.1% |
| Standard Deviation (Population) | 6.6% | 3.1% |
Similar Demographics by Seniors Poverty Over the Age of 65
Demographics Similar to Cajuns by Seniors Poverty Over the Age of 65
In terms of seniors poverty over the age of 65, the demographic groups most similar to Cajuns are Bermudan (11.9%, a difference of 0.050%), Yaqui (11.9%, a difference of 0.14%), Panamanian (11.9%, a difference of 0.24%), Iroquois (11.9%, a difference of 0.33%), and Immigrants from Eritrea (11.8%, a difference of 0.55%).
| Demographics | Rating | Rank | Seniors Poverty Over the Age of 65 |
| Immigrants | Nigeria | 3.4 /100 | #224 | Tragic 11.7% |
| Immigrants | Belarus | 3.2 /100 | #225 | Tragic 11.8% |
| Liberians | 3.2 /100 | #226 | Tragic 11.8% |
| Nigerians | 3.2 /100 | #227 | Tragic 11.8% |
| Immigrants | Costa Rica | 2.7 /100 | #228 | Tragic 11.8% |
| Immigrants | Eritrea | 2.6 /100 | #229 | Tragic 11.8% |
| Bermudans | 2.1 /100 | #230 | Tragic 11.9% |
| Cajuns | 2.0 /100 | #231 | Tragic 11.9% |
| Yaqui | 1.9 /100 | #232 | Tragic 11.9% |
| Panamanians | 1.8 /100 | #233 | Tragic 11.9% |
| Iroquois | 1.7 /100 | #234 | Tragic 11.9% |
| Immigrants | Argentina | 1.3 /100 | #235 | Tragic 12.0% |
| Immigrants | Peru | 1.3 /100 | #236 | Tragic 12.0% |
| Moroccans | 1.2 /100 | #237 | Tragic 12.0% |
| Seminole | 1.1 /100 | #238 | Tragic 12.0% |
Demographics Similar to Koreans by Seniors Poverty Over the Age of 65
In terms of seniors poverty over the age of 65, the demographic groups most similar to Koreans are Immigrants from Sri Lanka (10.1%, a difference of 0.030%), Immigrants from Ireland (10.0%, a difference of 0.10%), Immigrants from Bolivia (10.1%, a difference of 0.10%), White/Caucasian (10.0%, a difference of 0.11%), and Immigrants from Poland (10.1%, a difference of 0.13%).
| Demographics | Rating | Rank | Seniors Poverty Over the Age of 65 |
| Russians | 97.9 /100 | #73 | Exceptional 10.0% |
| Turks | 97.9 /100 | #74 | Exceptional 10.0% |
| Immigrants | Czechoslovakia | 97.8 /100 | #75 | Exceptional 10.0% |
| New Zealanders | 97.7 /100 | #76 | Exceptional 10.0% |
| Immigrants | South Africa | 97.7 /100 | #77 | Exceptional 10.0% |
| Whites/Caucasians | 97.5 /100 | #78 | Exceptional 10.0% |
| Immigrants | Ireland | 97.5 /100 | #79 | Exceptional 10.0% |
| Koreans | 97.4 /100 | #80 | Exceptional 10.1% |
| Immigrants | Sri Lanka | 97.3 /100 | #81 | Exceptional 10.1% |
| Immigrants | Bolivia | 97.3 /100 | #82 | Exceptional 10.1% |
| Immigrants | Poland | 97.2 /100 | #83 | Exceptional 10.1% |
| Immigrants | Afghanistan | 97.2 /100 | #84 | Exceptional 10.1% |
| Immigrants | Nepal | 97.2 /100 | #85 | Exceptional 10.1% |
| Romanians | 97.2 /100 | #86 | Exceptional 10.1% |
| Burmese | 97.2 /100 | #87 | Exceptional 10.1% |