Bulgarian vs Taiwanese Child Poverty Among Boys Under 16
COMPARE
Bulgarian
Taiwanese
Child Poverty Among Boys Under 16
Child Poverty Among Boys Under 16 Comparison
Bulgarians
Taiwanese
13.3%
CHILD POVERTY AMONG BOYS UNDER 16
99.9/ 100
METRIC RATING
18th/ 347
METRIC RANK
14.8%
CHILD POVERTY AMONG BOYS UNDER 16
97.3/ 100
METRIC RATING
85th/ 347
METRIC RANK
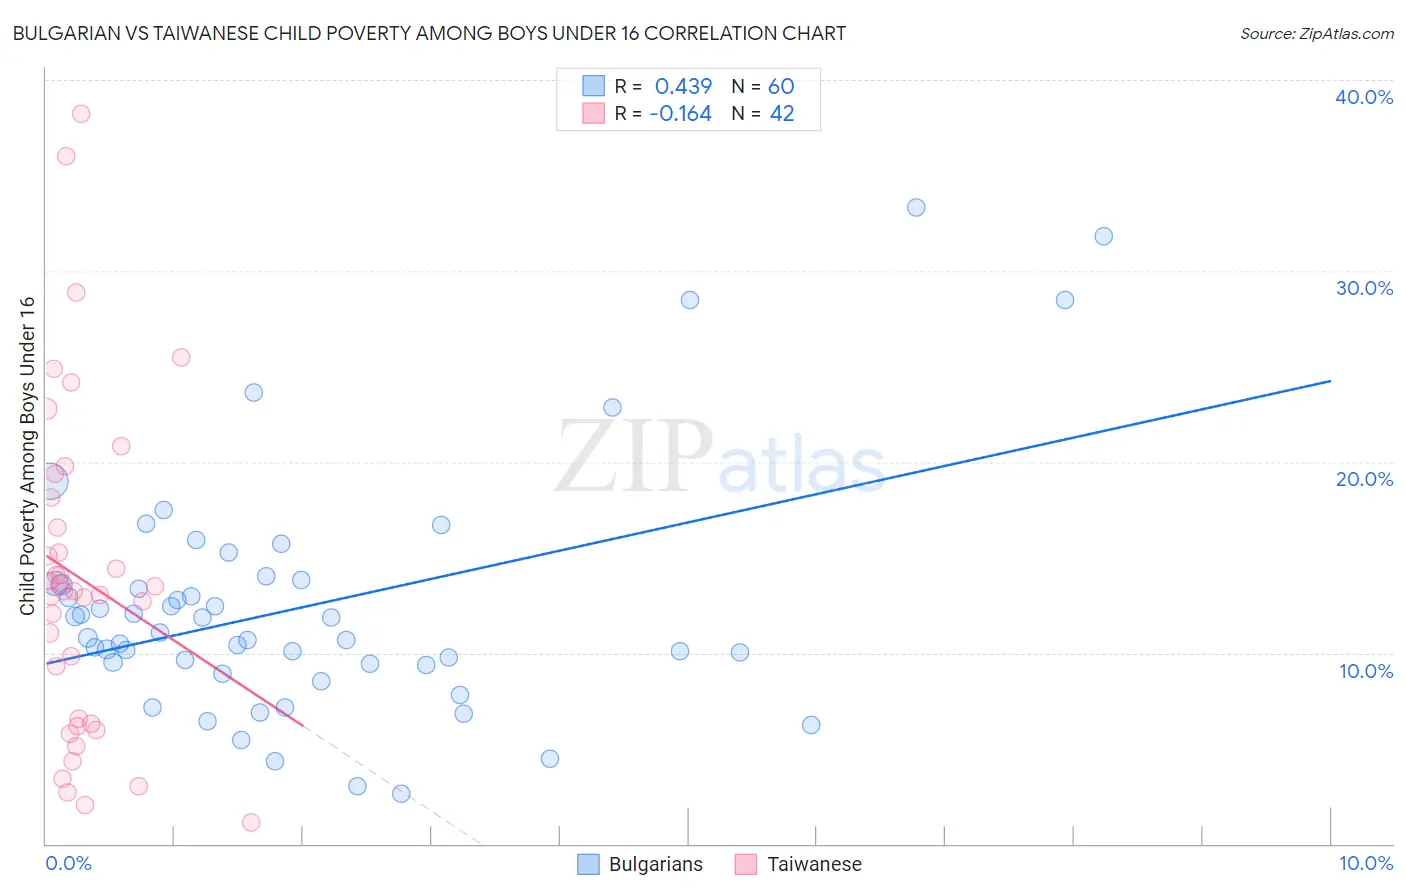
Bulgarian vs Taiwanese Child Poverty Among Boys Under 16 Correlation Chart
The statistical analysis conducted on geographies consisting of 203,586,421 people shows a moderate positive correlation between the proportion of Bulgarians and poverty level among boys under the age of 16 in the United States with a correlation coefficient (R) of 0.439 and weighted average of 13.3%. Similarly, the statistical analysis conducted on geographies consisting of 31,649,664 people shows a poor negative correlation between the proportion of Taiwanese and poverty level among boys under the age of 16 in the United States with a correlation coefficient (R) of -0.164 and weighted average of 14.8%, a difference of 11.6%.
Child Poverty Among Boys Under 16 Correlation Summary
| Measurement | Bulgarian | Taiwanese |
| Minimum | 2.6% | 1.1% |
| Maximum | 33.3% | 38.2% |
| Range | 30.7% | 37.2% |
| Mean | 12.5% | 13.8% |
| Median | 10.9% | 13.2% |
| Interquartile 25% (IQ1) | 9.4% | 6.3% |
| Interquartile 75% (IQ3) | 13.7% | 18.1% |
| Interquartile Range (IQR) | 4.3% | 11.8% |
| Standard Deviation (Sample) | 6.4% | 8.7% |
| Standard Deviation (Population) | 6.3% | 8.5% |
Similar Demographics by Child Poverty Among Boys Under 16
Demographics Similar to Bulgarians by Child Poverty Among Boys Under 16
In terms of child poverty among boys under 16, the demographic groups most similar to Bulgarians are Bolivian (13.3%, a difference of 0.060%), Indian (Asian) (13.3%, a difference of 0.10%), Norwegian (13.2%, a difference of 0.53%), Maltese (13.2%, a difference of 0.62%), and Immigrants from Eastern Asia (13.3%, a difference of 0.70%).
| Demographics | Rating | Rank | Child Poverty Among Boys Under 16 |
| Immigrants | South Central Asia | 100.0 /100 | #11 | Exceptional 12.7% |
| Burmese | 99.9 /100 | #12 | Exceptional 13.0% |
| Immigrants | Korea | 99.9 /100 | #13 | Exceptional 13.0% |
| Immigrants | Ireland | 99.9 /100 | #14 | Exceptional 13.1% |
| Immigrants | Japan | 99.9 /100 | #15 | Exceptional 13.1% |
| Maltese | 99.9 /100 | #16 | Exceptional 13.2% |
| Norwegians | 99.9 /100 | #17 | Exceptional 13.2% |
| Bulgarians | 99.9 /100 | #18 | Exceptional 13.3% |
| Bolivians | 99.9 /100 | #19 | Exceptional 13.3% |
| Indians (Asian) | 99.9 /100 | #20 | Exceptional 13.3% |
| Immigrants | Eastern Asia | 99.9 /100 | #21 | Exceptional 13.3% |
| Tongans | 99.9 /100 | #22 | Exceptional 13.4% |
| Latvians | 99.9 /100 | #23 | Exceptional 13.4% |
| Immigrants | Lithuania | 99.8 /100 | #24 | Exceptional 13.5% |
| Okinawans | 99.8 /100 | #25 | Exceptional 13.5% |
Demographics Similar to Taiwanese by Child Poverty Among Boys Under 16
In terms of child poverty among boys under 16, the demographic groups most similar to Taiwanese are Swiss (14.8%, a difference of 0.040%), German (14.8%, a difference of 0.070%), Northern European (14.8%, a difference of 0.12%), Immigrants from North America (14.8%, a difference of 0.13%), and Immigrants from South Africa (14.8%, a difference of 0.16%).
| Demographics | Rating | Rank | Child Poverty Among Boys Under 16 |
| Egyptians | 97.8 /100 | #78 | Exceptional 14.7% |
| Immigrants | Eastern Europe | 97.8 /100 | #79 | Exceptional 14.7% |
| Immigrants | Russia | 97.7 /100 | #80 | Exceptional 14.7% |
| Immigrants | Canada | 97.6 /100 | #81 | Exceptional 14.7% |
| Ukrainians | 97.6 /100 | #82 | Exceptional 14.7% |
| Immigrants | South Africa | 97.4 /100 | #83 | Exceptional 14.8% |
| Swiss | 97.3 /100 | #84 | Exceptional 14.8% |
| Taiwanese | 97.3 /100 | #85 | Exceptional 14.8% |
| Germans | 97.2 /100 | #86 | Exceptional 14.8% |
| Northern Europeans | 97.2 /100 | #87 | Exceptional 14.8% |
| Immigrants | North America | 97.1 /100 | #88 | Exceptional 14.8% |
| Immigrants | Argentina | 97.1 /100 | #89 | Exceptional 14.8% |
| Austrians | 97.1 /100 | #90 | Exceptional 14.8% |
| Paraguayans | 96.8 /100 | #91 | Exceptional 14.9% |
| Argentineans | 96.7 /100 | #92 | Exceptional 14.9% |