Bulgarian vs Costa Rican Child Poverty Among Boys Under 16
COMPARE
Bulgarian
Costa Rican
Child Poverty Among Boys Under 16
Child Poverty Among Boys Under 16 Comparison
Bulgarians
Costa Ricans
13.3%
CHILD POVERTY AMONG BOYS UNDER 16
99.9/ 100
METRIC RATING
18th/ 347
METRIC RANK
16.1%
CHILD POVERTY AMONG BOYS UNDER 16
68.1/ 100
METRIC RATING
163rd/ 347
METRIC RANK
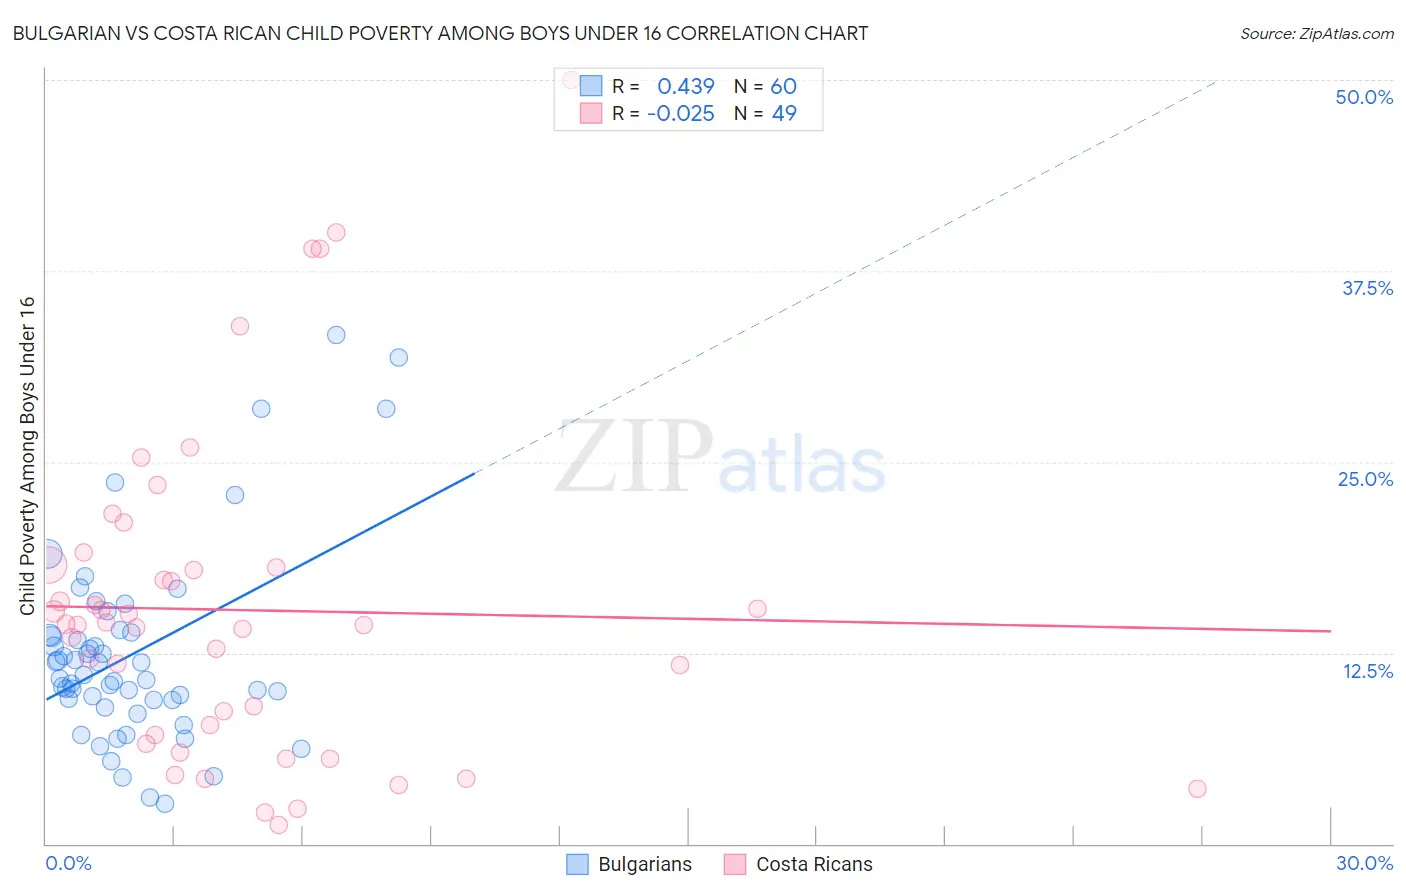
Bulgarian vs Costa Rican Child Poverty Among Boys Under 16 Correlation Chart
The statistical analysis conducted on geographies consisting of 203,586,421 people shows a moderate positive correlation between the proportion of Bulgarians and poverty level among boys under the age of 16 in the United States with a correlation coefficient (R) of 0.439 and weighted average of 13.3%. Similarly, the statistical analysis conducted on geographies consisting of 251,285,350 people shows no correlation between the proportion of Costa Ricans and poverty level among boys under the age of 16 in the United States with a correlation coefficient (R) of -0.025 and weighted average of 16.1%, a difference of 21.3%.
Child Poverty Among Boys Under 16 Correlation Summary
| Measurement | Bulgarian | Costa Rican |
| Minimum | 2.6% | 1.2% |
| Maximum | 33.3% | 50.0% |
| Range | 30.7% | 48.8% |
| Mean | 12.5% | 15.3% |
| Median | 10.9% | 14.3% |
| Interquartile 25% (IQ1) | 9.4% | 6.9% |
| Interquartile 75% (IQ3) | 13.7% | 18.2% |
| Interquartile Range (IQR) | 4.3% | 11.3% |
| Standard Deviation (Sample) | 6.4% | 10.7% |
| Standard Deviation (Population) | 6.3% | 10.6% |
Similar Demographics by Child Poverty Among Boys Under 16
Demographics Similar to Bulgarians by Child Poverty Among Boys Under 16
In terms of child poverty among boys under 16, the demographic groups most similar to Bulgarians are Bolivian (13.3%, a difference of 0.060%), Indian (Asian) (13.3%, a difference of 0.10%), Norwegian (13.2%, a difference of 0.53%), Maltese (13.2%, a difference of 0.62%), and Immigrants from Eastern Asia (13.3%, a difference of 0.70%).
| Demographics | Rating | Rank | Child Poverty Among Boys Under 16 |
| Immigrants | South Central Asia | 100.0 /100 | #11 | Exceptional 12.7% |
| Burmese | 99.9 /100 | #12 | Exceptional 13.0% |
| Immigrants | Korea | 99.9 /100 | #13 | Exceptional 13.0% |
| Immigrants | Ireland | 99.9 /100 | #14 | Exceptional 13.1% |
| Immigrants | Japan | 99.9 /100 | #15 | Exceptional 13.1% |
| Maltese | 99.9 /100 | #16 | Exceptional 13.2% |
| Norwegians | 99.9 /100 | #17 | Exceptional 13.2% |
| Bulgarians | 99.9 /100 | #18 | Exceptional 13.3% |
| Bolivians | 99.9 /100 | #19 | Exceptional 13.3% |
| Indians (Asian) | 99.9 /100 | #20 | Exceptional 13.3% |
| Immigrants | Eastern Asia | 99.9 /100 | #21 | Exceptional 13.3% |
| Tongans | 99.9 /100 | #22 | Exceptional 13.4% |
| Latvians | 99.9 /100 | #23 | Exceptional 13.4% |
| Immigrants | Lithuania | 99.8 /100 | #24 | Exceptional 13.5% |
| Okinawans | 99.8 /100 | #25 | Exceptional 13.5% |
Demographics Similar to Costa Ricans by Child Poverty Among Boys Under 16
In terms of child poverty among boys under 16, the demographic groups most similar to Costa Ricans are Immigrants from Albania (16.1%, a difference of 0.020%), Guamanian/Chamorro (16.1%, a difference of 0.20%), Colombian (16.1%, a difference of 0.38%), Immigrants from Oceania (16.0%, a difference of 0.43%), and Immigrants from Northern Africa (16.0%, a difference of 0.44%).
| Demographics | Rating | Rank | Child Poverty Among Boys Under 16 |
| Israelis | 76.5 /100 | #156 | Good 15.9% |
| Immigrants | Nepal | 76.0 /100 | #157 | Good 15.9% |
| Yugoslavians | 75.9 /100 | #158 | Good 15.9% |
| Immigrants | Chile | 74.8 /100 | #159 | Good 15.9% |
| Immigrants | Northern Africa | 71.3 /100 | #160 | Good 16.0% |
| Immigrants | Oceania | 71.3 /100 | #161 | Good 16.0% |
| Guamanians/Chamorros | 69.6 /100 | #162 | Good 16.1% |
| Costa Ricans | 68.1 /100 | #163 | Good 16.1% |
| Immigrants | Albania | 67.9 /100 | #164 | Good 16.1% |
| Colombians | 65.2 /100 | #165 | Good 16.1% |
| Immigrants | Germany | 63.6 /100 | #166 | Good 16.2% |
| Afghans | 55.4 /100 | #167 | Average 16.3% |
| South Americans | 55.3 /100 | #168 | Average 16.3% |
| Immigrants | Saudi Arabia | 53.6 /100 | #169 | Average 16.4% |
| Immigrants | Bosnia and Herzegovina | 51.7 /100 | #170 | Average 16.4% |