Immigrants from Kazakhstan vs Syrian Receiving Food Stamps
COMPARE
Immigrants from Kazakhstan
Syrian
Receiving Food Stamps
Receiving Food Stamps Comparison
Immigrants from Kazakhstan
Syrians
11.1%
RECEIVING FOOD STAMPS
81.7/ 100
METRIC RATING
152nd/ 347
METRIC RANK
11.0%
RECEIVING FOOD STAMPS
85.5/ 100
METRIC RATING
144th/ 347
METRIC RANK
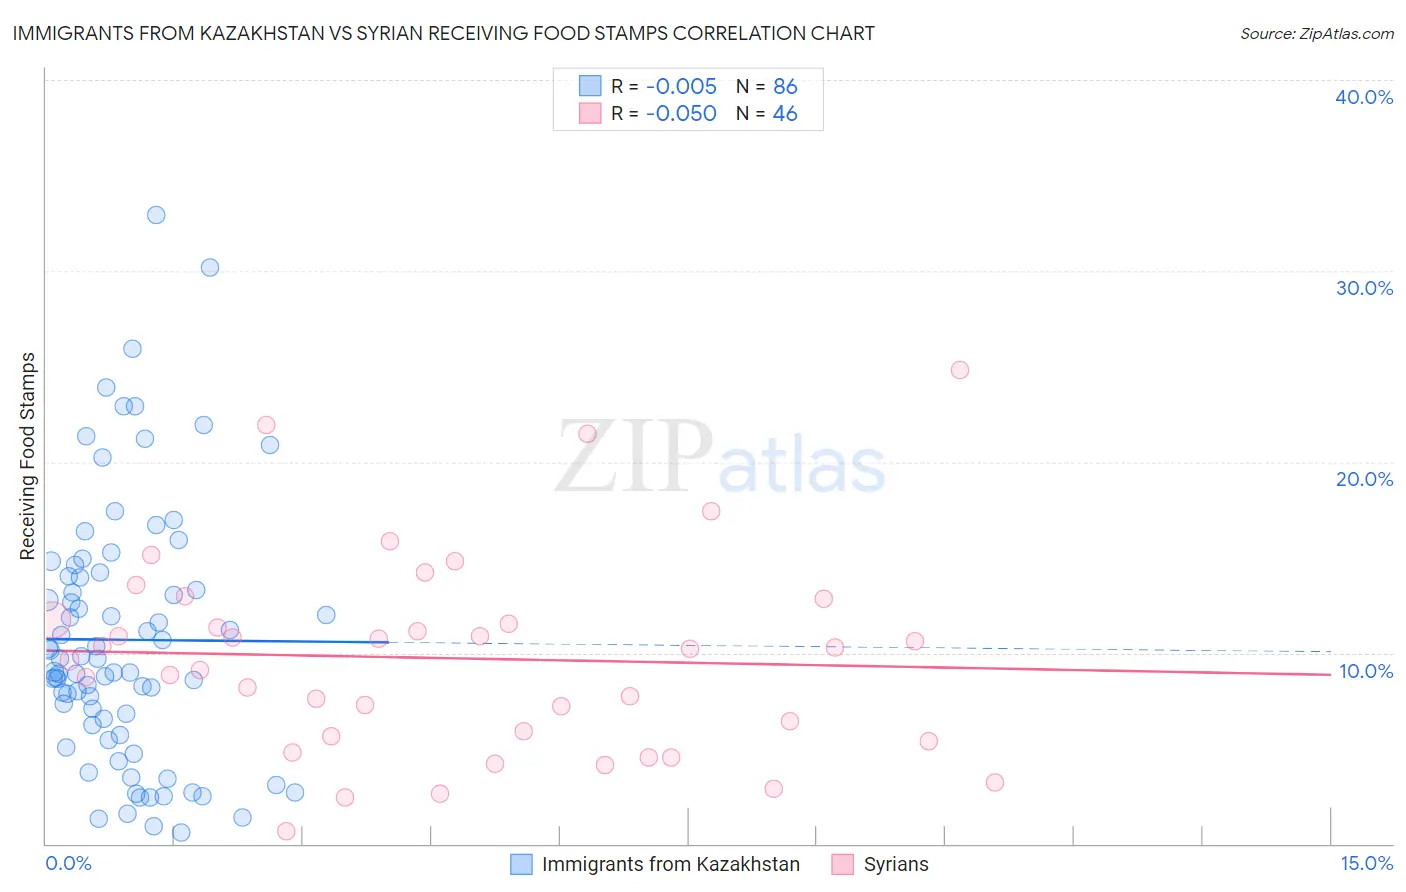
Immigrants from Kazakhstan vs Syrian Receiving Food Stamps Correlation Chart
The statistical analysis conducted on geographies consisting of 124,341,154 people shows no correlation between the proportion of Immigrants from Kazakhstan and percentage of population receiving government assistance and/or food stamps in the United States with a correlation coefficient (R) of -0.005 and weighted average of 11.1%. Similarly, the statistical analysis conducted on geographies consisting of 265,711,936 people shows a slight negative correlation between the proportion of Syrians and percentage of population receiving government assistance and/or food stamps in the United States with a correlation coefficient (R) of -0.050 and weighted average of 11.0%, a difference of 1.0%.
Receiving Food Stamps Correlation Summary
| Measurement | Immigrants from Kazakhstan | Syrian |
| Minimum | 0.60% | 0.68% |
| Maximum | 32.9% | 24.8% |
| Range | 32.3% | 24.1% |
| Mean | 10.7% | 9.7% |
| Median | 9.3% | 9.9% |
| Interquartile 25% (IQ1) | 6.2% | 5.6% |
| Interquartile 75% (IQ3) | 14.0% | 11.7% |
| Interquartile Range (IQR) | 7.8% | 6.1% |
| Standard Deviation (Sample) | 6.8% | 5.3% |
| Standard Deviation (Population) | 6.7% | 5.2% |
Demographics Similar to Immigrants from Kazakhstan and Syrians by Receiving Food Stamps
In terms of receiving food stamps, the demographic groups most similar to Immigrants from Kazakhstan are Immigrants from Spain (11.1%, a difference of 0.0%), Lebanese (11.1%, a difference of 0.020%), Armenian (11.1%, a difference of 0.080%), Immigrants from Argentina (11.2%, a difference of 0.33%), and Soviet Union (11.1%, a difference of 0.36%). Similarly, the demographic groups most similar to Syrians are Hungarian (11.0%, a difference of 0.12%), Immigrants from Northern Africa (11.0%, a difference of 0.15%), Chilean (11.0%, a difference of 0.23%), Taiwanese (11.0%, a difference of 0.36%), and Immigrants from Vietnam (11.0%, a difference of 0.40%).
| Demographics | Rating | Rank | Receiving Food Stamps |
| Immigrants | Moldova | 88.5 /100 | #138 | Excellent 10.9% |
| Hmong | 88.4 /100 | #139 | Excellent 10.9% |
| Celtics | 87.8 /100 | #140 | Excellent 10.9% |
| Immigrants | Vietnam | 86.7 /100 | #141 | Excellent 11.0% |
| Chileans | 86.2 /100 | #142 | Excellent 11.0% |
| Immigrants | Northern Africa | 86.0 /100 | #143 | Excellent 11.0% |
| Syrians | 85.5 /100 | #144 | Excellent 11.0% |
| Hungarians | 85.1 /100 | #145 | Excellent 11.0% |
| Taiwanese | 84.2 /100 | #146 | Excellent 11.0% |
| Whites/Caucasians | 83.9 /100 | #147 | Excellent 11.1% |
| Immigrants | South Eastern Asia | 83.3 /100 | #148 | Excellent 11.1% |
| Brazilians | 83.2 /100 | #149 | Excellent 11.1% |
| Soviet Union | 83.1 /100 | #150 | Excellent 11.1% |
| Immigrants | Spain | 81.7 /100 | #151 | Excellent 11.1% |
| Immigrants | Kazakhstan | 81.7 /100 | #152 | Excellent 11.1% |
| Lebanese | 81.6 /100 | #153 | Excellent 11.1% |
| Armenians | 81.4 /100 | #154 | Excellent 11.1% |
| Immigrants | Argentina | 80.4 /100 | #155 | Excellent 11.2% |
| Immigrants | Afghanistan | 75.6 /100 | #156 | Good 11.3% |
| Immigrants | Lebanon | 75.2 /100 | #157 | Good 11.3% |
| Immigrants | Bosnia and Herzegovina | 72.6 /100 | #158 | Good 11.3% |