Brazilian vs Croatian Single Female Poverty
COMPARE
Brazilian
Croatian
Single Female Poverty
Single Female Poverty Comparison
Brazilians
Croatians
20.1%
SINGLE FEMALE POVERTY
94.4/ 100
METRIC RATING
123rd/ 347
METRIC RANK
19.7%
SINGLE FEMALE POVERTY
98.1/ 100
METRIC RATING
97th/ 347
METRIC RANK
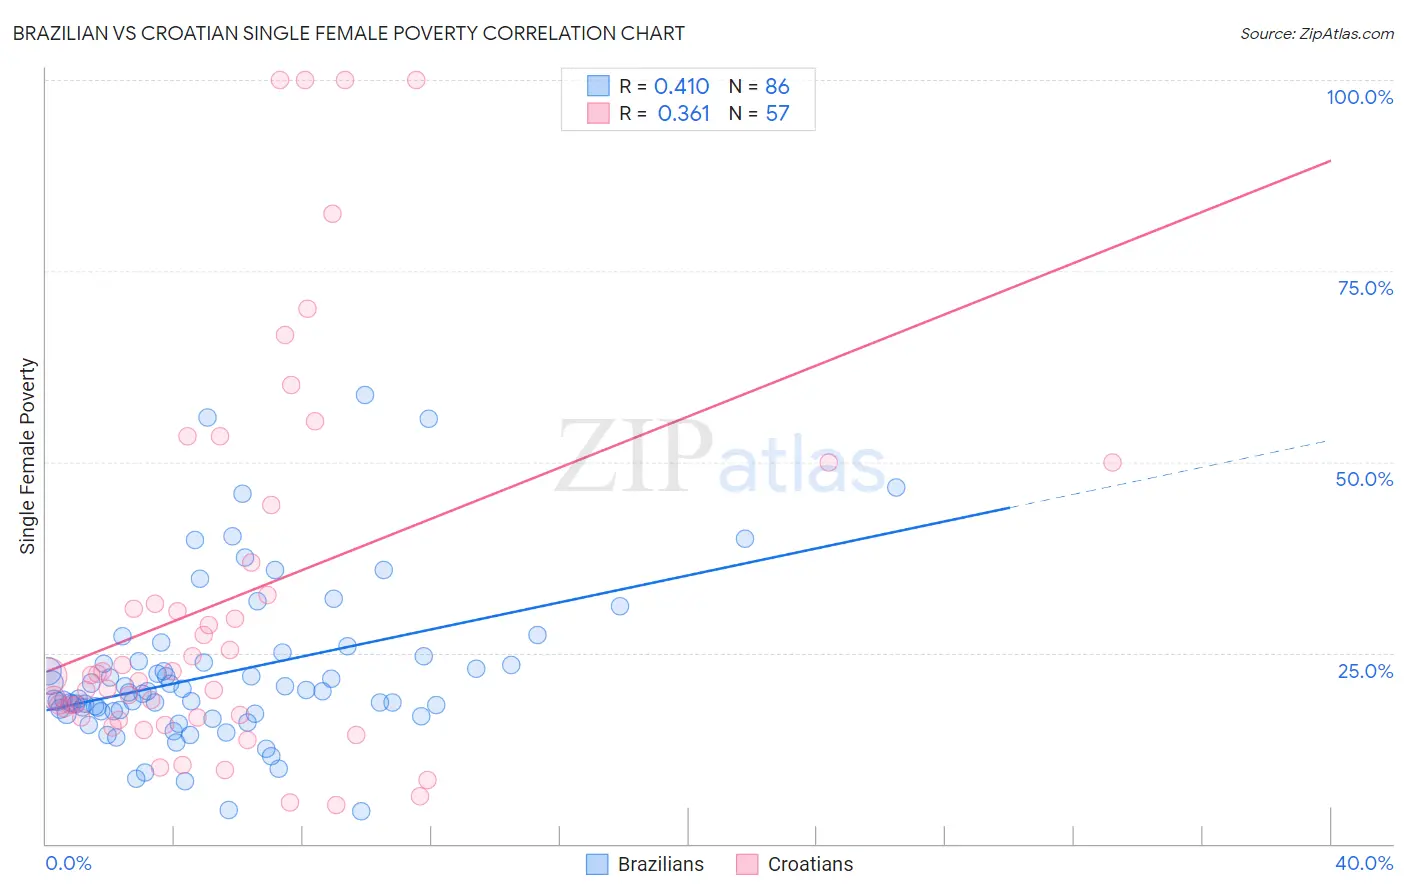
Brazilian vs Croatian Single Female Poverty Correlation Chart
The statistical analysis conducted on geographies consisting of 319,523,574 people shows a moderate positive correlation between the proportion of Brazilians and poverty level among single females in the United States with a correlation coefficient (R) of 0.410 and weighted average of 20.1%. Similarly, the statistical analysis conducted on geographies consisting of 368,567,193 people shows a mild positive correlation between the proportion of Croatians and poverty level among single females in the United States with a correlation coefficient (R) of 0.361 and weighted average of 19.7%, a difference of 1.8%.
Single Female Poverty Correlation Summary
| Measurement | Brazilian | Croatian |
| Minimum | 4.3% | 5.0% |
| Maximum | 58.7% | 100.0% |
| Range | 54.4% | 95.0% |
| Mean | 22.4% | 32.0% |
| Median | 19.7% | 22.1% |
| Interquartile 25% (IQ1) | 17.3% | 16.5% |
| Interquartile 75% (IQ3) | 23.9% | 40.6% |
| Interquartile Range (IQR) | 6.6% | 24.0% |
| Standard Deviation (Sample) | 10.5% | 25.3% |
| Standard Deviation (Population) | 10.4% | 25.1% |
Similar Demographics by Single Female Poverty
Demographics Similar to Brazilians by Single Female Poverty
In terms of single female poverty, the demographic groups most similar to Brazilians are Immigrants from Chile (20.1%, a difference of 0.030%), Immigrants from South Africa (20.1%, a difference of 0.15%), Immigrants from South America (20.0%, a difference of 0.18%), Immigrants from Switzerland (20.0%, a difference of 0.21%), and South American (20.0%, a difference of 0.24%).
| Demographics | Rating | Rank | Single Female Poverty |
| Immigrants | Kazakhstan | 95.7 /100 | #116 | Exceptional 20.0% |
| Poles | 95.6 /100 | #117 | Exceptional 20.0% |
| Immigrants | Afghanistan | 95.4 /100 | #118 | Exceptional 20.0% |
| Immigrants | Ethiopia | 95.4 /100 | #119 | Exceptional 20.0% |
| South Americans | 95.1 /100 | #120 | Exceptional 20.0% |
| Immigrants | Switzerland | 95.1 /100 | #121 | Exceptional 20.0% |
| Immigrants | South America | 95.0 /100 | #122 | Exceptional 20.0% |
| Brazilians | 94.4 /100 | #123 | Exceptional 20.1% |
| Immigrants | Chile | 94.3 /100 | #124 | Exceptional 20.1% |
| Immigrants | South Africa | 93.9 /100 | #125 | Exceptional 20.1% |
| Serbians | 93.3 /100 | #126 | Exceptional 20.1% |
| Mongolians | 93.2 /100 | #127 | Exceptional 20.2% |
| Immigrants | Spain | 92.7 /100 | #128 | Exceptional 20.2% |
| Immigrants | Morocco | 92.4 /100 | #129 | Exceptional 20.2% |
| Immigrants | Hungary | 92.3 /100 | #130 | Exceptional 20.2% |
Demographics Similar to Croatians by Single Female Poverty
In terms of single female poverty, the demographic groups most similar to Croatians are Immigrants from Brazil (19.7%, a difference of 0.090%), Immigrants from France (19.7%, a difference of 0.13%), Estonian (19.7%, a difference of 0.14%), Sierra Leonean (19.7%, a difference of 0.14%), and Ukrainian (19.8%, a difference of 0.39%).
| Demographics | Rating | Rank | Single Female Poverty |
| Immigrants | Lebanon | 98.8 /100 | #90 | Exceptional 19.6% |
| Soviet Union | 98.8 /100 | #91 | Exceptional 19.6% |
| Italians | 98.8 /100 | #92 | Exceptional 19.6% |
| Immigrants | Austria | 98.8 /100 | #93 | Exceptional 19.6% |
| Romanians | 98.6 /100 | #94 | Exceptional 19.6% |
| Estonians | 98.2 /100 | #95 | Exceptional 19.7% |
| Immigrants | Brazil | 98.2 /100 | #96 | Exceptional 19.7% |
| Croatians | 98.1 /100 | #97 | Exceptional 19.7% |
| Immigrants | France | 97.9 /100 | #98 | Exceptional 19.7% |
| Sierra Leoneans | 97.9 /100 | #99 | Exceptional 19.7% |
| Ukrainians | 97.6 /100 | #100 | Exceptional 19.8% |
| Immigrants | Belgium | 97.3 /100 | #101 | Exceptional 19.8% |
| Immigrants | Cameroon | 97.3 /100 | #102 | Exceptional 19.8% |
| Immigrants | Southern Europe | 97.1 /100 | #103 | Exceptional 19.9% |
| Chileans | 96.9 /100 | #104 | Exceptional 19.9% |