Bolivian vs Immigrants from Singapore Child Poverty Among Girls Under 16
COMPARE
Bolivian
Immigrants from Singapore
Child Poverty Among Girls Under 16
Child Poverty Among Girls Under 16 Comparison
Bolivians
Immigrants from Singapore
13.6%
CHILD POVERTY AMONG GIRLS UNDER 16
99.8/ 100
METRIC RATING
29th/ 347
METRIC RANK
12.5%
CHILD POVERTY AMONG GIRLS UNDER 16
100.0/ 100
METRIC RATING
9th/ 347
METRIC RANK
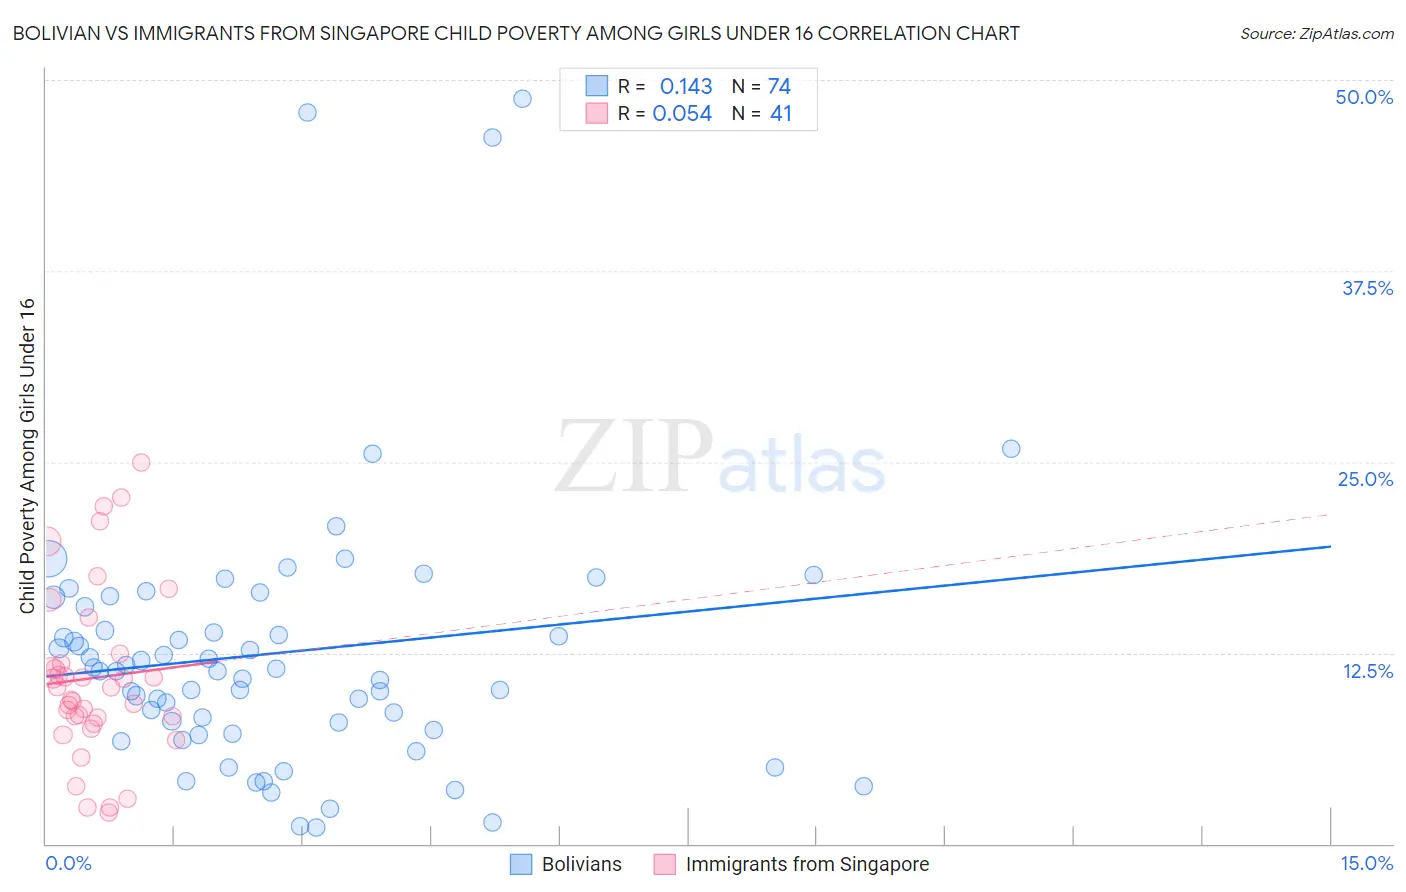
Bolivian vs Immigrants from Singapore Child Poverty Among Girls Under 16 Correlation Chart
The statistical analysis conducted on geographies consisting of 183,239,714 people shows a poor positive correlation between the proportion of Bolivians and poverty level among girls under the age of 16 in the United States with a correlation coefficient (R) of 0.143 and weighted average of 13.6%. Similarly, the statistical analysis conducted on geographies consisting of 136,137,761 people shows a slight positive correlation between the proportion of Immigrants from Singapore and poverty level among girls under the age of 16 in the United States with a correlation coefficient (R) of 0.054 and weighted average of 12.5%, a difference of 9.0%.
Child Poverty Among Girls Under 16 Correlation Summary
| Measurement | Bolivian | Immigrants from Singapore |
| Minimum | 1.0% | 2.0% |
| Maximum | 48.7% | 25.0% |
| Range | 47.7% | 23.0% |
| Mean | 12.5% | 10.9% |
| Median | 11.3% | 10.3% |
| Interquartile 25% (IQ1) | 7.5% | 8.1% |
| Interquartile 75% (IQ3) | 15.5% | 12.1% |
| Interquartile Range (IQR) | 8.1% | 4.0% |
| Standard Deviation (Sample) | 9.0% | 5.5% |
| Standard Deviation (Population) | 8.9% | 5.5% |
Demographics Similar to Bolivians and Immigrants from Singapore by Child Poverty Among Girls Under 16
In terms of child poverty among girls under 16, the demographic groups most similar to Bolivians are Tongan (13.6%, a difference of 0.12%), Latvian (13.5%, a difference of 0.38%), Eastern European (13.5%, a difference of 0.40%), Immigrants from China (13.4%, a difference of 1.2%), and Immigrants from Eastern Asia (13.4%, a difference of 1.7%). Similarly, the demographic groups most similar to Immigrants from Singapore are Immigrants from Iran (12.6%, a difference of 0.94%), Immigrants from South Central Asia (12.7%, a difference of 2.2%), Bhutanese (12.7%, a difference of 2.2%), Immigrants from Ireland (12.9%, a difference of 3.3%), and Burmese (13.0%, a difference of 4.4%).
| Demographics | Rating | Rank | Child Poverty Among Girls Under 16 |
| Immigrants | Singapore | 100.0 /100 | #9 | Exceptional 12.5% |
| Immigrants | Iran | 100.0 /100 | #10 | Exceptional 12.6% |
| Immigrants | South Central Asia | 100.0 /100 | #11 | Exceptional 12.7% |
| Bhutanese | 100.0 /100 | #12 | Exceptional 12.7% |
| Immigrants | Ireland | 99.9 /100 | #13 | Exceptional 12.9% |
| Burmese | 99.9 /100 | #14 | Exceptional 13.0% |
| Okinawans | 99.9 /100 | #15 | Exceptional 13.0% |
| Immigrants | Lithuania | 99.9 /100 | #16 | Exceptional 13.1% |
| Bulgarians | 99.9 /100 | #17 | Exceptional 13.1% |
| Immigrants | Korea | 99.9 /100 | #18 | Exceptional 13.1% |
| Cypriots | 99.9 /100 | #19 | Exceptional 13.2% |
| Immigrants | Japan | 99.9 /100 | #20 | Exceptional 13.3% |
| Assyrians/Chaldeans/Syriacs | 99.9 /100 | #21 | Exceptional 13.3% |
| Indians (Asian) | 99.9 /100 | #22 | Exceptional 13.3% |
| Norwegians | 99.9 /100 | #23 | Exceptional 13.3% |
| Immigrants | Eastern Asia | 99.9 /100 | #24 | Exceptional 13.4% |
| Immigrants | China | 99.8 /100 | #25 | Exceptional 13.4% |
| Eastern Europeans | 99.8 /100 | #26 | Exceptional 13.5% |
| Latvians | 99.8 /100 | #27 | Exceptional 13.5% |
| Tongans | 99.8 /100 | #28 | Exceptional 13.6% |
| Bolivians | 99.8 /100 | #29 | Exceptional 13.6% |