Black/African American vs Senegalese Doctorate Degree
COMPARE
Black/African American
Senegalese
Doctorate Degree
Doctorate Degree Comparison
Blacks/African Americans
Senegalese
1.4%
DOCTORATE DEGREE
0.3/ 100
METRIC RATING
291st/ 347
METRIC RANK
2.0%
DOCTORATE DEGREE
86.7/ 100
METRIC RATING
141st/ 347
METRIC RANK
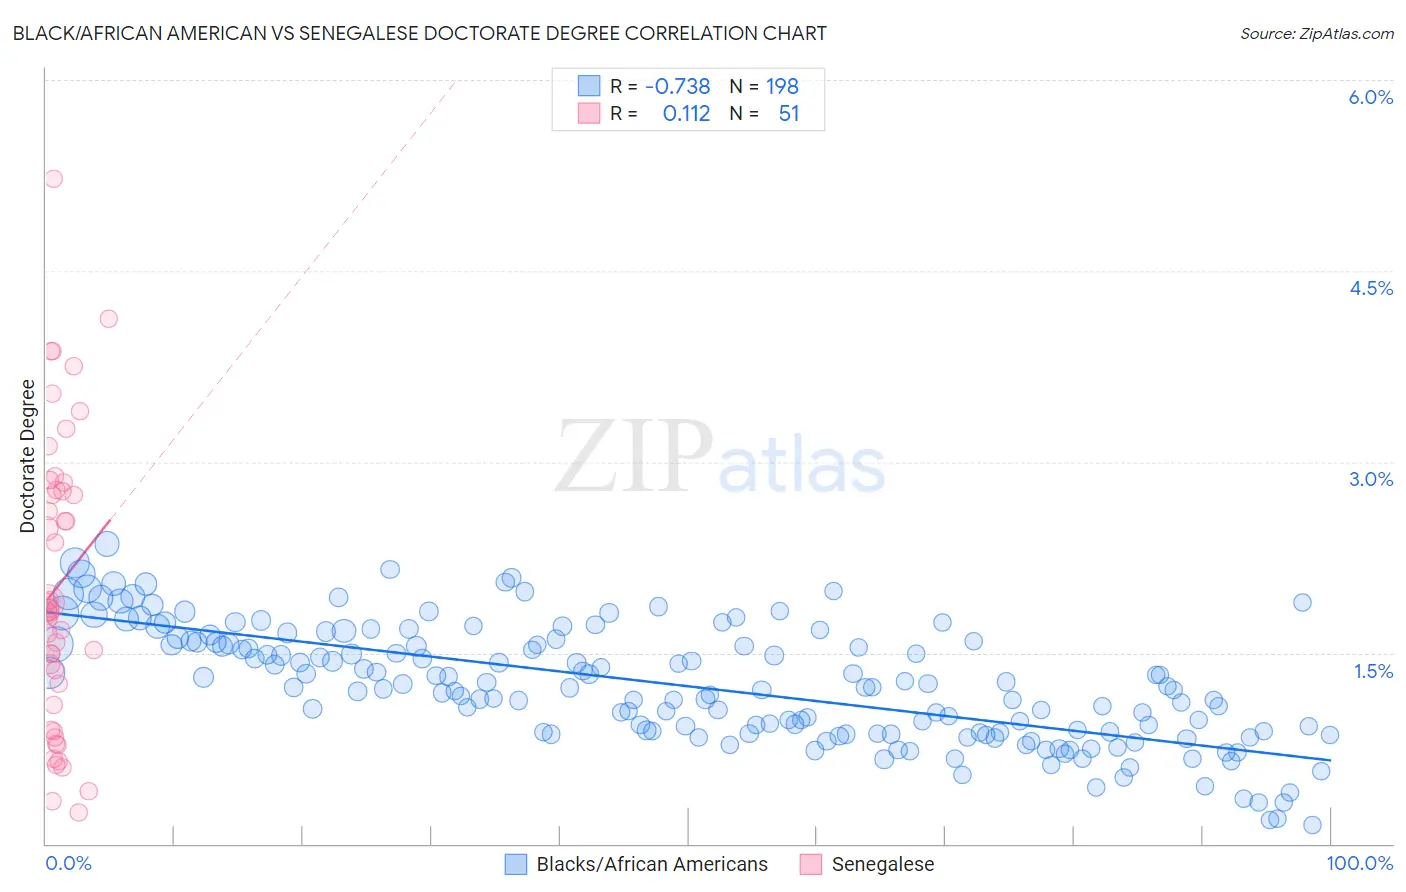
Black/African American vs Senegalese Doctorate Degree Correlation Chart
The statistical analysis conducted on geographies consisting of 542,418,709 people shows a strong negative correlation between the proportion of Blacks/African Americans and percentage of population with at least doctorate degree education in the United States with a correlation coefficient (R) of -0.738 and weighted average of 1.4%. Similarly, the statistical analysis conducted on geographies consisting of 78,037,705 people shows a poor positive correlation between the proportion of Senegalese and percentage of population with at least doctorate degree education in the United States with a correlation coefficient (R) of 0.112 and weighted average of 2.0%, a difference of 36.2%.
Doctorate Degree Correlation Summary
| Measurement | Black/African American | Senegalese |
| Minimum | 0.15% | 0.24% |
| Maximum | 2.4% | 5.2% |
| Range | 2.2% | 5.0% |
| Mean | 1.2% | 2.0% |
| Median | 1.2% | 1.8% |
| Interquartile 25% (IQ1) | 0.87% | 1.1% |
| Interquartile 75% (IQ3) | 1.6% | 2.8% |
| Interquartile Range (IQR) | 0.71% | 1.7% |
| Standard Deviation (Sample) | 0.46% | 1.1% |
| Standard Deviation (Population) | 0.46% | 1.1% |
Similar Demographics by Doctorate Degree
Demographics Similar to Blacks/African Americans by Doctorate Degree
In terms of doctorate degree, the demographic groups most similar to Blacks/African Americans are Alaska Native (1.4%, a difference of 0.17%), Choctaw (1.4%, a difference of 0.23%), Cape Verdean (1.4%, a difference of 0.24%), Immigrants from El Salvador (1.4%, a difference of 0.38%), and Cajun (1.5%, a difference of 0.56%).
| Demographics | Rating | Rank | Doctorate Degree |
| Jamaicans | 0.3 /100 | #284 | Tragic 1.5% |
| Malaysians | 0.3 /100 | #285 | Tragic 1.5% |
| Cherokee | 0.3 /100 | #286 | Tragic 1.5% |
| Cajuns | 0.3 /100 | #287 | Tragic 1.5% |
| Immigrants | El Salvador | 0.3 /100 | #288 | Tragic 1.4% |
| Cape Verdeans | 0.3 /100 | #289 | Tragic 1.4% |
| Choctaw | 0.3 /100 | #290 | Tragic 1.4% |
| Blacks/African Americans | 0.3 /100 | #291 | Tragic 1.4% |
| Alaska Natives | 0.3 /100 | #292 | Tragic 1.4% |
| Immigrants | Yemen | 0.2 /100 | #293 | Tragic 1.4% |
| Samoans | 0.2 /100 | #294 | Tragic 1.4% |
| Guatemalans | 0.2 /100 | #295 | Tragic 1.4% |
| Immigrants | Ecuador | 0.2 /100 | #296 | Tragic 1.4% |
| Tsimshian | 0.2 /100 | #297 | Tragic 1.4% |
| Puerto Ricans | 0.1 /100 | #298 | Tragic 1.4% |
Demographics Similar to Senegalese by Doctorate Degree
In terms of doctorate degree, the demographic groups most similar to Senegalese are Immigrants from Africa (2.0%, a difference of 0.070%), Afghan (2.0%, a difference of 0.16%), Italian (2.0%, a difference of 0.21%), Swiss (2.0%, a difference of 0.38%), and Sierra Leonean (2.0%, a difference of 0.46%).
| Demographics | Rating | Rank | Doctorate Degree |
| Immigrants | Cameroon | 88.9 /100 | #134 | Excellent 2.0% |
| Serbians | 88.7 /100 | #135 | Excellent 2.0% |
| Swedes | 88.3 /100 | #136 | Excellent 2.0% |
| South American Indians | 88.3 /100 | #137 | Excellent 2.0% |
| Swiss | 88.0 /100 | #138 | Excellent 2.0% |
| Afghans | 87.2 /100 | #139 | Excellent 2.0% |
| Immigrants | Africa | 87.0 /100 | #140 | Excellent 2.0% |
| Senegalese | 86.7 /100 | #141 | Excellent 2.0% |
| Italians | 86.0 /100 | #142 | Excellent 2.0% |
| Sierra Leoneans | 85.1 /100 | #143 | Excellent 2.0% |
| Immigrants | Moldova | 84.3 /100 | #144 | Excellent 2.0% |
| Kenyans | 83.6 /100 | #145 | Excellent 1.9% |
| Immigrants | Syria | 83.6 /100 | #146 | Excellent 1.9% |
| Immigrants | Senegal | 82.5 /100 | #147 | Excellent 1.9% |
| Luxembourgers | 81.1 /100 | #148 | Excellent 1.9% |