Blackfeet vs Immigrants from Israel Seniors Poverty Over the Age of 65
COMPARE
Blackfeet
Immigrants from Israel
Seniors Poverty Over the Age of 65
Seniors Poverty Over the Age of 65 Comparison
Blackfeet
Immigrants from Israel
12.6%
SENIORS POVERTY OVER THE AGE OF 65
0.1/ 100
METRIC RATING
267th/ 347
METRIC RANK
11.3%
SENIORS POVERTY OVER THE AGE OF 65
20.3/ 100
METRIC RATING
199th/ 347
METRIC RANK
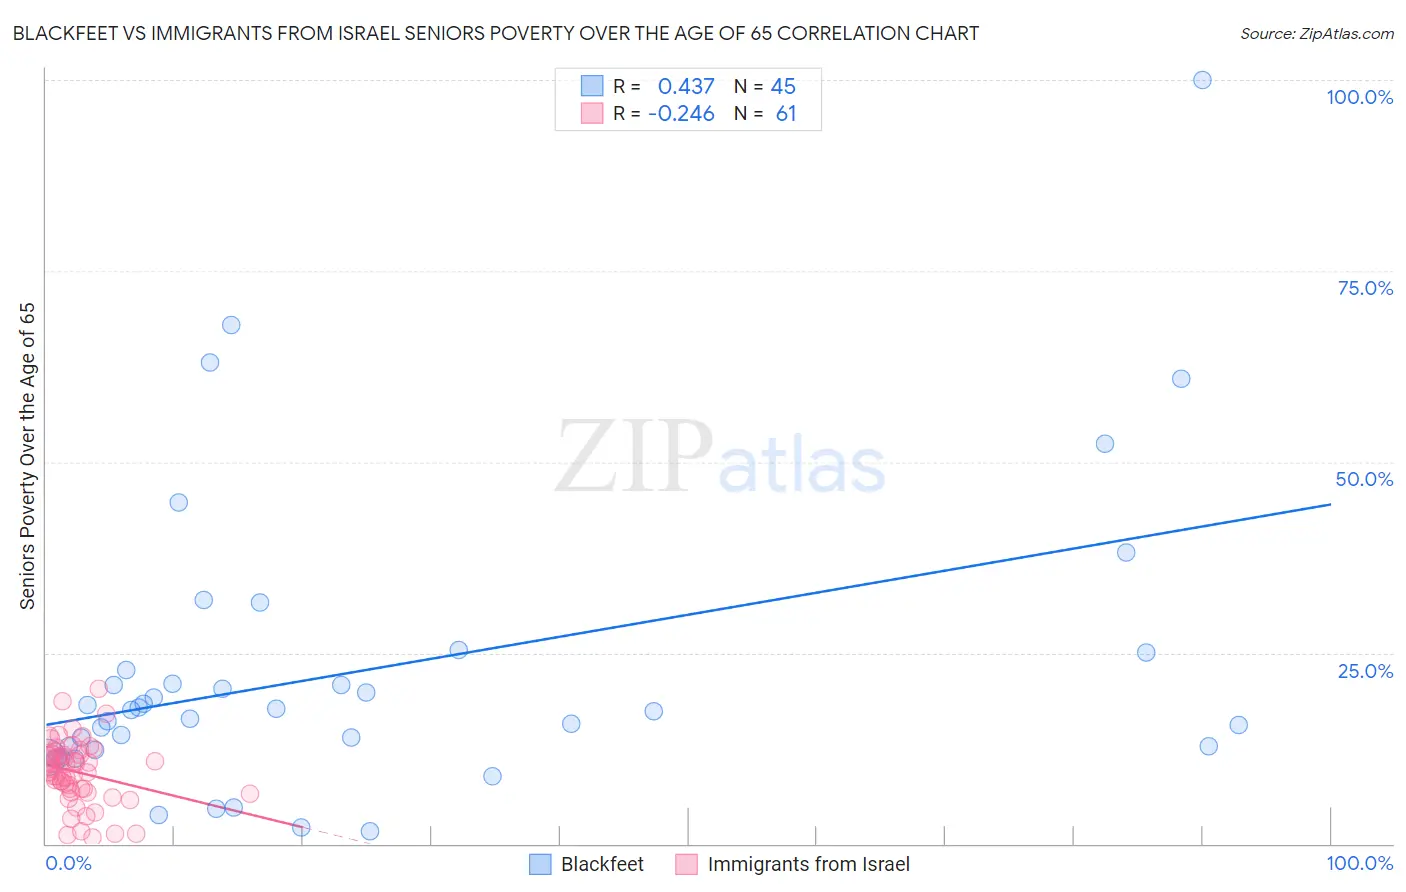
Blackfeet vs Immigrants from Israel Seniors Poverty Over the Age of 65 Correlation Chart
The statistical analysis conducted on geographies consisting of 308,743,142 people shows a moderate positive correlation between the proportion of Blackfeet and poverty level among seniors over the age of 65 in the United States with a correlation coefficient (R) of 0.437 and weighted average of 12.6%. Similarly, the statistical analysis conducted on geographies consisting of 209,667,882 people shows a weak negative correlation between the proportion of Immigrants from Israel and poverty level among seniors over the age of 65 in the United States with a correlation coefficient (R) of -0.246 and weighted average of 11.3%, a difference of 11.9%.
Seniors Poverty Over the Age of 65 Correlation Summary
| Measurement | Blackfeet | Immigrants from Israel |
| Minimum | 1.6% | 0.80% |
| Maximum | 100.0% | 20.2% |
| Range | 98.4% | 19.4% |
| Mean | 22.7% | 9.4% |
| Median | 17.6% | 9.4% |
| Interquartile 25% (IQ1) | 12.5% | 6.9% |
| Interquartile 75% (IQ3) | 23.9% | 11.7% |
| Interquartile Range (IQR) | 11.3% | 4.8% |
| Standard Deviation (Sample) | 19.3% | 4.1% |
| Standard Deviation (Population) | 19.1% | 4.1% |
Similar Demographics by Seniors Poverty Over the Age of 65
Demographics Similar to Blackfeet by Seniors Poverty Over the Age of 65
In terms of seniors poverty over the age of 65, the demographic groups most similar to Blackfeet are Immigrants from Somalia (12.6%, a difference of 0.10%), African (12.6%, a difference of 0.14%), Immigrants from Western Africa (12.6%, a difference of 0.31%), Inupiat (12.6%, a difference of 0.40%), and Soviet Union (12.6%, a difference of 0.47%).
| Demographics | Rating | Rank | Seniors Poverty Over the Age of 65 |
| South Americans | 0.2 /100 | #260 | Tragic 12.5% |
| Colombians | 0.2 /100 | #261 | Tragic 12.5% |
| Venezuelans | 0.1 /100 | #262 | Tragic 12.5% |
| Soviet Union | 0.1 /100 | #263 | Tragic 12.6% |
| Inupiat | 0.1 /100 | #264 | Tragic 12.6% |
| Immigrants | Western Africa | 0.1 /100 | #265 | Tragic 12.6% |
| Africans | 0.1 /100 | #266 | Tragic 12.6% |
| Blackfeet | 0.1 /100 | #267 | Tragic 12.6% |
| Immigrants | Somalia | 0.1 /100 | #268 | Tragic 12.6% |
| Immigrants | Venezuela | 0.1 /100 | #269 | Tragic 12.7% |
| Immigrants | South America | 0.1 /100 | #270 | Tragic 12.7% |
| Immigrants | Ghana | 0.1 /100 | #271 | Tragic 12.8% |
| Immigrants | Uruguay | 0.1 /100 | #272 | Tragic 12.8% |
| Kiowa | 0.0 /100 | #273 | Tragic 12.8% |
| Salvadorans | 0.0 /100 | #274 | Tragic 12.8% |
Demographics Similar to Immigrants from Israel by Seniors Poverty Over the Age of 65
In terms of seniors poverty over the age of 65, the demographic groups most similar to Immigrants from Israel are Alsatian (11.3%, a difference of 0.020%), Immigrants from Burma/Myanmar (11.3%, a difference of 0.13%), Immigrants from Brazil (11.3%, a difference of 0.35%), Costa Rican (11.3%, a difference of 0.47%), and Immigrants from Zaire (11.3%, a difference of 0.48%).
| Demographics | Rating | Rank | Seniors Poverty Over the Age of 65 |
| Immigrants | Southern Europe | 30.1 /100 | #192 | Fair 11.1% |
| Taiwanese | 29.2 /100 | #193 | Fair 11.2% |
| Chileans | 27.8 /100 | #194 | Fair 11.2% |
| Immigrants | Vietnam | 26.6 /100 | #195 | Fair 11.2% |
| Bangladeshis | 25.2 /100 | #196 | Fair 11.2% |
| Albanians | 24.4 /100 | #197 | Fair 11.2% |
| Immigrants | Burma/Myanmar | 21.3 /100 | #198 | Fair 11.3% |
| Immigrants | Israel | 20.3 /100 | #199 | Fair 11.3% |
| Alsatians | 20.1 /100 | #200 | Fair 11.3% |
| Immigrants | Brazil | 17.8 /100 | #201 | Poor 11.3% |
| Costa Ricans | 17.0 /100 | #202 | Poor 11.3% |
| Immigrants | Zaire | 16.9 /100 | #203 | Poor 11.3% |
| Israelis | 16.5 /100 | #204 | Poor 11.3% |
| Brazilians | 15.4 /100 | #205 | Poor 11.3% |
| Choctaw | 14.5 /100 | #206 | Poor 11.4% |