Blackfeet vs Immigrants from Northern Europe Seniors Poverty Over the Age of 65
COMPARE
Blackfeet
Immigrants from Northern Europe
Seniors Poverty Over the Age of 65
Seniors Poverty Over the Age of 65 Comparison
Blackfeet
Immigrants from Northern Europe
12.6%
SENIORS POVERTY OVER THE AGE OF 65
0.1/ 100
METRIC RATING
267th/ 347
METRIC RANK
9.8%
SENIORS POVERTY OVER THE AGE OF 65
99.2/ 100
METRIC RATING
54th/ 347
METRIC RANK
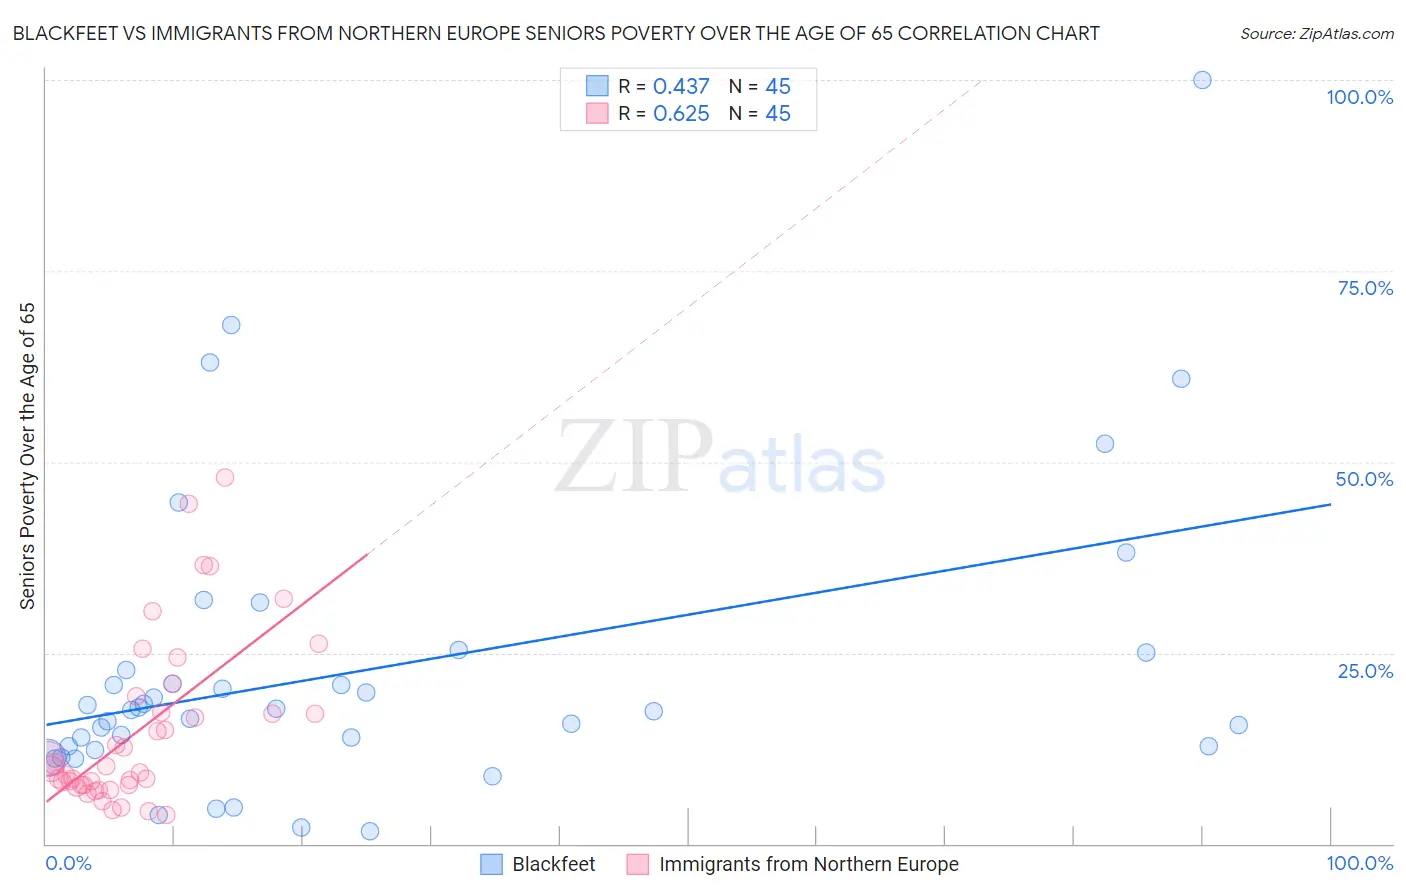
Blackfeet vs Immigrants from Northern Europe Seniors Poverty Over the Age of 65 Correlation Chart
The statistical analysis conducted on geographies consisting of 308,743,142 people shows a moderate positive correlation between the proportion of Blackfeet and poverty level among seniors over the age of 65 in the United States with a correlation coefficient (R) of 0.437 and weighted average of 12.6%. Similarly, the statistical analysis conducted on geographies consisting of 474,875,758 people shows a significant positive correlation between the proportion of Immigrants from Northern Europe and poverty level among seniors over the age of 65 in the United States with a correlation coefficient (R) of 0.625 and weighted average of 9.8%, a difference of 29.2%.
Seniors Poverty Over the Age of 65 Correlation Summary
| Measurement | Blackfeet | Immigrants from Northern Europe |
| Minimum | 1.6% | 3.7% |
| Maximum | 100.0% | 48.0% |
| Range | 98.4% | 44.3% |
| Mean | 22.7% | 14.8% |
| Median | 17.6% | 9.8% |
| Interquartile 25% (IQ1) | 12.5% | 7.7% |
| Interquartile 75% (IQ3) | 23.9% | 18.3% |
| Interquartile Range (IQR) | 11.3% | 10.6% |
| Standard Deviation (Sample) | 19.3% | 11.0% |
| Standard Deviation (Population) | 19.1% | 10.9% |
Similar Demographics by Seniors Poverty Over the Age of 65
Demographics Similar to Blackfeet by Seniors Poverty Over the Age of 65
In terms of seniors poverty over the age of 65, the demographic groups most similar to Blackfeet are Immigrants from Somalia (12.6%, a difference of 0.10%), African (12.6%, a difference of 0.14%), Immigrants from Western Africa (12.6%, a difference of 0.31%), Inupiat (12.6%, a difference of 0.40%), and Soviet Union (12.6%, a difference of 0.47%).
| Demographics | Rating | Rank | Seniors Poverty Over the Age of 65 |
| South Americans | 0.2 /100 | #260 | Tragic 12.5% |
| Colombians | 0.2 /100 | #261 | Tragic 12.5% |
| Venezuelans | 0.1 /100 | #262 | Tragic 12.5% |
| Soviet Union | 0.1 /100 | #263 | Tragic 12.6% |
| Inupiat | 0.1 /100 | #264 | Tragic 12.6% |
| Immigrants | Western Africa | 0.1 /100 | #265 | Tragic 12.6% |
| Africans | 0.1 /100 | #266 | Tragic 12.6% |
| Blackfeet | 0.1 /100 | #267 | Tragic 12.6% |
| Immigrants | Somalia | 0.1 /100 | #268 | Tragic 12.6% |
| Immigrants | Venezuela | 0.1 /100 | #269 | Tragic 12.7% |
| Immigrants | South America | 0.1 /100 | #270 | Tragic 12.7% |
| Immigrants | Ghana | 0.1 /100 | #271 | Tragic 12.8% |
| Immigrants | Uruguay | 0.1 /100 | #272 | Tragic 12.8% |
| Kiowa | 0.0 /100 | #273 | Tragic 12.8% |
| Salvadorans | 0.0 /100 | #274 | Tragic 12.8% |
Demographics Similar to Immigrants from Northern Europe by Seniors Poverty Over the Age of 65
In terms of seniors poverty over the age of 65, the demographic groups most similar to Immigrants from Northern Europe are Slavic (9.8%, a difference of 0.060%), Afghan (9.8%, a difference of 0.13%), Filipino (9.7%, a difference of 0.16%), Carpatho Rusyn (9.7%, a difference of 0.19%), and Immigrants from England (9.8%, a difference of 0.25%).
| Demographics | Rating | Rank | Seniors Poverty Over the Age of 65 |
| Immigrants | South Central Asia | 99.5 /100 | #47 | Exceptional 9.7% |
| French | 99.5 /100 | #48 | Exceptional 9.7% |
| Immigrants | Lithuania | 99.4 /100 | #49 | Exceptional 9.7% |
| Hungarians | 99.4 /100 | #50 | Exceptional 9.7% |
| Carpatho Rusyns | 99.3 /100 | #51 | Exceptional 9.7% |
| Filipinos | 99.3 /100 | #52 | Exceptional 9.7% |
| Slavs | 99.2 /100 | #53 | Exceptional 9.8% |
| Immigrants | Northern Europe | 99.2 /100 | #54 | Exceptional 9.8% |
| Afghans | 99.2 /100 | #55 | Exceptional 9.8% |
| Immigrants | England | 99.1 /100 | #56 | Exceptional 9.8% |
| Bolivians | 99.1 /100 | #57 | Exceptional 9.8% |
| Serbians | 99.1 /100 | #58 | Exceptional 9.8% |
| Immigrants | Canada | 99.0 /100 | #59 | Exceptional 9.8% |
| Celtics | 99.0 /100 | #60 | Exceptional 9.8% |
| Iranians | 98.9 /100 | #61 | Exceptional 9.8% |