Blackfeet vs Polish Seniors Poverty Over the Age of 65
COMPARE
Blackfeet
Polish
Seniors Poverty Over the Age of 65
Seniors Poverty Over the Age of 65 Comparison
Blackfeet
Poles
12.6%
SENIORS POVERTY OVER THE AGE OF 65
0.1/ 100
METRIC RATING
267th/ 347
METRIC RANK
9.1%
SENIORS POVERTY OVER THE AGE OF 65
99.9/ 100
METRIC RATING
14th/ 347
METRIC RANK
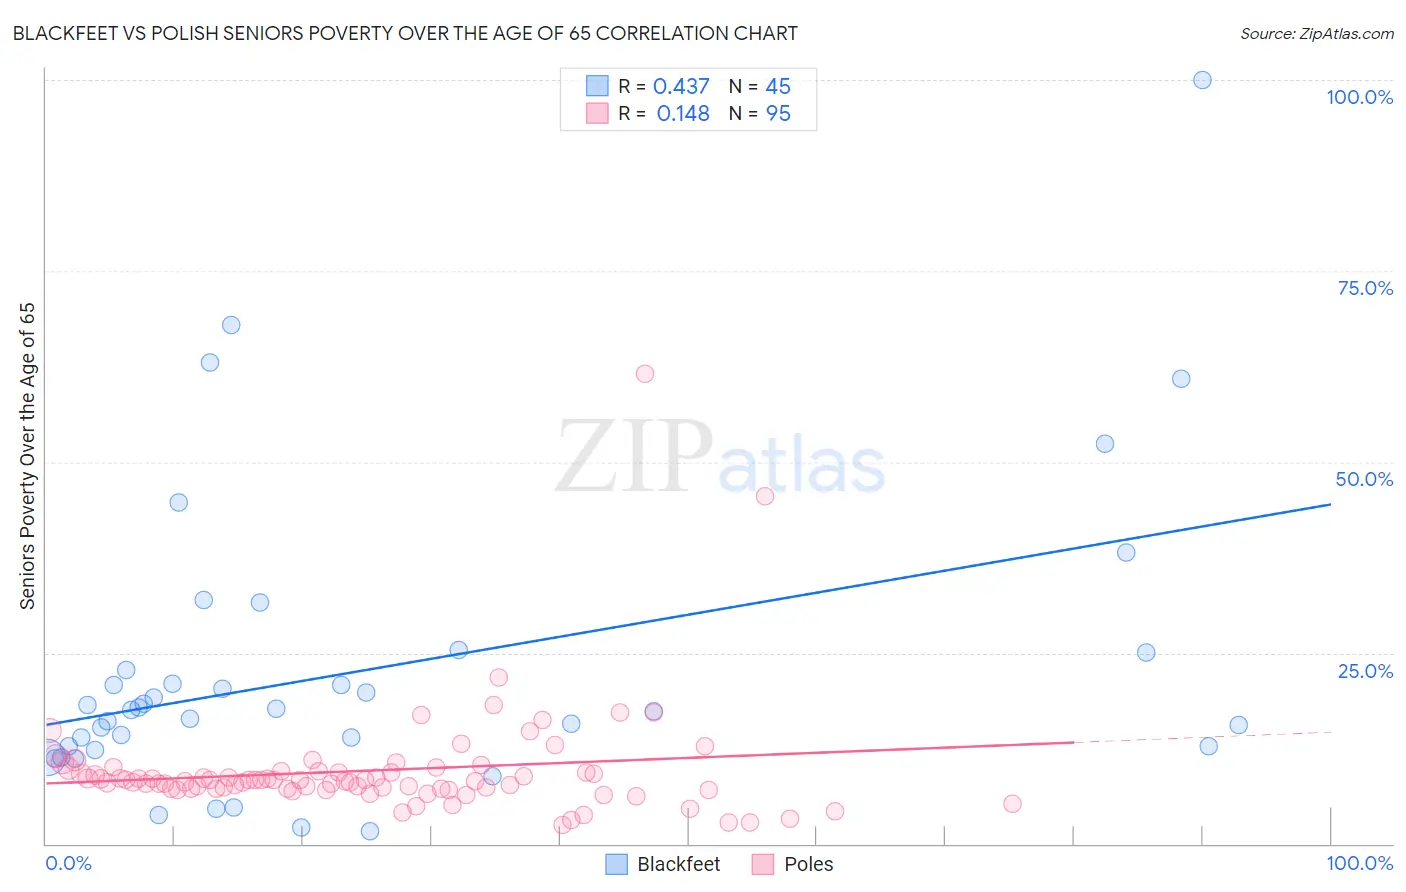
Blackfeet vs Polish Seniors Poverty Over the Age of 65 Correlation Chart
The statistical analysis conducted on geographies consisting of 308,743,142 people shows a moderate positive correlation between the proportion of Blackfeet and poverty level among seniors over the age of 65 in the United States with a correlation coefficient (R) of 0.437 and weighted average of 12.6%. Similarly, the statistical analysis conducted on geographies consisting of 555,313,476 people shows a poor positive correlation between the proportion of Poles and poverty level among seniors over the age of 65 in the United States with a correlation coefficient (R) of 0.148 and weighted average of 9.1%, a difference of 38.1%.
Seniors Poverty Over the Age of 65 Correlation Summary
| Measurement | Blackfeet | Polish |
| Minimum | 1.6% | 2.4% |
| Maximum | 100.0% | 61.5% |
| Range | 98.4% | 59.2% |
| Mean | 22.7% | 9.6% |
| Median | 17.6% | 8.3% |
| Interquartile 25% (IQ1) | 12.5% | 7.2% |
| Interquartile 75% (IQ3) | 23.9% | 9.5% |
| Interquartile Range (IQR) | 11.3% | 2.3% |
| Standard Deviation (Sample) | 19.3% | 7.4% |
| Standard Deviation (Population) | 19.1% | 7.3% |
Similar Demographics by Seniors Poverty Over the Age of 65
Demographics Similar to Blackfeet by Seniors Poverty Over the Age of 65
In terms of seniors poverty over the age of 65, the demographic groups most similar to Blackfeet are Immigrants from Somalia (12.6%, a difference of 0.10%), African (12.6%, a difference of 0.14%), Immigrants from Western Africa (12.6%, a difference of 0.31%), Inupiat (12.6%, a difference of 0.40%), and Soviet Union (12.6%, a difference of 0.47%).
| Demographics | Rating | Rank | Seniors Poverty Over the Age of 65 |
| South Americans | 0.2 /100 | #260 | Tragic 12.5% |
| Colombians | 0.2 /100 | #261 | Tragic 12.5% |
| Venezuelans | 0.1 /100 | #262 | Tragic 12.5% |
| Soviet Union | 0.1 /100 | #263 | Tragic 12.6% |
| Inupiat | 0.1 /100 | #264 | Tragic 12.6% |
| Immigrants | Western Africa | 0.1 /100 | #265 | Tragic 12.6% |
| Africans | 0.1 /100 | #266 | Tragic 12.6% |
| Blackfeet | 0.1 /100 | #267 | Tragic 12.6% |
| Immigrants | Somalia | 0.1 /100 | #268 | Tragic 12.6% |
| Immigrants | Venezuela | 0.1 /100 | #269 | Tragic 12.7% |
| Immigrants | South America | 0.1 /100 | #270 | Tragic 12.7% |
| Immigrants | Ghana | 0.1 /100 | #271 | Tragic 12.8% |
| Immigrants | Uruguay | 0.1 /100 | #272 | Tragic 12.8% |
| Kiowa | 0.0 /100 | #273 | Tragic 12.8% |
| Salvadorans | 0.0 /100 | #274 | Tragic 12.8% |
Demographics Similar to Poles by Seniors Poverty Over the Age of 65
In terms of seniors poverty over the age of 65, the demographic groups most similar to Poles are Croatian (9.1%, a difference of 0.030%), Dutch (9.1%, a difference of 0.070%), Scandinavian (9.1%, a difference of 0.080%), Maltese (9.1%, a difference of 0.26%), and European (9.2%, a difference of 0.43%).
| Demographics | Rating | Rank | Seniors Poverty Over the Age of 65 |
| Germans | 100.0 /100 | #7 | Exceptional 9.0% |
| Czechs | 100.0 /100 | #8 | Exceptional 9.0% |
| English | 100.0 /100 | #9 | Exceptional 9.1% |
| Lithuanians | 100.0 /100 | #10 | Exceptional 9.1% |
| Maltese | 99.9 /100 | #11 | Exceptional 9.1% |
| Scandinavians | 99.9 /100 | #12 | Exceptional 9.1% |
| Croatians | 99.9 /100 | #13 | Exceptional 9.1% |
| Poles | 99.9 /100 | #14 | Exceptional 9.1% |
| Dutch | 99.9 /100 | #15 | Exceptional 9.1% |
| Europeans | 99.9 /100 | #16 | Exceptional 9.2% |
| Scottish | 99.9 /100 | #17 | Exceptional 9.2% |
| Slovaks | 99.9 /100 | #18 | Exceptional 9.2% |
| Swiss | 99.9 /100 | #19 | Exceptional 9.2% |
| Thais | 99.9 /100 | #20 | Exceptional 9.2% |
| Luxembourgers | 99.9 /100 | #21 | Exceptional 9.2% |