Immigrants from Brazil vs Immigrants from Israel Seniors Poverty Over the Age of 65
COMPARE
Immigrants from Brazil
Immigrants from Israel
Seniors Poverty Over the Age of 65
Seniors Poverty Over the Age of 65 Comparison
Immigrants from Brazil
Immigrants from Israel
11.3%
SENIORS POVERTY OVER THE AGE OF 65
17.8/ 100
METRIC RATING
201st/ 347
METRIC RANK
11.3%
SENIORS POVERTY OVER THE AGE OF 65
20.3/ 100
METRIC RATING
199th/ 347
METRIC RANK
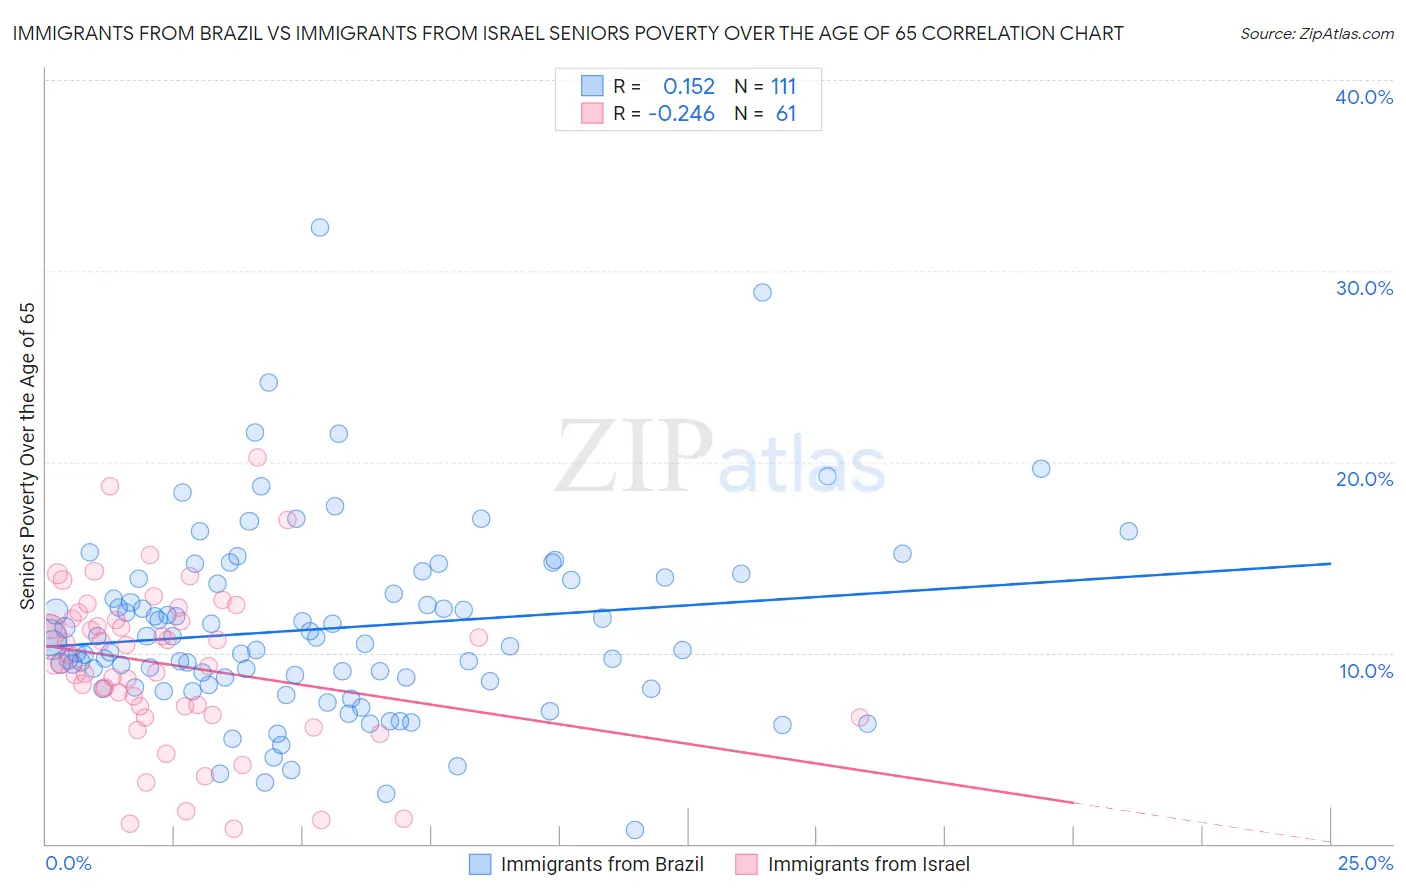
Immigrants from Brazil vs Immigrants from Israel Seniors Poverty Over the Age of 65 Correlation Chart
The statistical analysis conducted on geographies consisting of 342,003,546 people shows a poor positive correlation between the proportion of Immigrants from Brazil and poverty level among seniors over the age of 65 in the United States with a correlation coefficient (R) of 0.152 and weighted average of 11.3%. Similarly, the statistical analysis conducted on geographies consisting of 209,667,882 people shows a weak negative correlation between the proportion of Immigrants from Israel and poverty level among seniors over the age of 65 in the United States with a correlation coefficient (R) of -0.246 and weighted average of 11.3%, a difference of 0.35%.
Seniors Poverty Over the Age of 65 Correlation Summary
| Measurement | Immigrants from Brazil | Immigrants from Israel |
| Minimum | 0.74% | 0.80% |
| Maximum | 32.3% | 20.2% |
| Range | 31.5% | 19.4% |
| Mean | 11.3% | 9.4% |
| Median | 10.4% | 9.4% |
| Interquartile 25% (IQ1) | 8.3% | 6.9% |
| Interquartile 75% (IQ3) | 13.8% | 11.7% |
| Interquartile Range (IQR) | 5.4% | 4.8% |
| Standard Deviation (Sample) | 4.9% | 4.1% |
| Standard Deviation (Population) | 4.9% | 4.1% |
Demographics Similar to Immigrants from Brazil and Immigrants from Israel by Seniors Poverty Over the Age of 65
In terms of seniors poverty over the age of 65, the demographic groups most similar to Immigrants from Brazil are Costa Rican (11.3%, a difference of 0.12%), Immigrants from Zaire (11.3%, a difference of 0.13%), Israeli (11.3%, a difference of 0.19%), Alsatian (11.3%, a difference of 0.33%), and Brazilian (11.3%, a difference of 0.37%). Similarly, the demographic groups most similar to Immigrants from Israel are Alsatian (11.3%, a difference of 0.020%), Immigrants from Burma/Myanmar (11.3%, a difference of 0.13%), Costa Rican (11.3%, a difference of 0.47%), Immigrants from Zaire (11.3%, a difference of 0.48%), and Albanian (11.2%, a difference of 0.52%).
| Demographics | Rating | Rank | Seniors Poverty Over the Age of 65 |
| Indians (Asian) | 34.2 /100 | #190 | Fair 11.1% |
| Immigrants | Uganda | 32.2 /100 | #191 | Fair 11.1% |
| Immigrants | Southern Europe | 30.1 /100 | #192 | Fair 11.1% |
| Taiwanese | 29.2 /100 | #193 | Fair 11.2% |
| Chileans | 27.8 /100 | #194 | Fair 11.2% |
| Immigrants | Vietnam | 26.6 /100 | #195 | Fair 11.2% |
| Bangladeshis | 25.2 /100 | #196 | Fair 11.2% |
| Albanians | 24.4 /100 | #197 | Fair 11.2% |
| Immigrants | Burma/Myanmar | 21.3 /100 | #198 | Fair 11.3% |
| Immigrants | Israel | 20.3 /100 | #199 | Fair 11.3% |
| Alsatians | 20.1 /100 | #200 | Fair 11.3% |
| Immigrants | Brazil | 17.8 /100 | #201 | Poor 11.3% |
| Costa Ricans | 17.0 /100 | #202 | Poor 11.3% |
| Immigrants | Zaire | 16.9 /100 | #203 | Poor 11.3% |
| Israelis | 16.5 /100 | #204 | Poor 11.3% |
| Brazilians | 15.4 /100 | #205 | Poor 11.3% |
| Choctaw | 14.5 /100 | #206 | Poor 11.4% |
| Immigrants | Western Asia | 13.6 /100 | #207 | Poor 11.4% |
| South American Indians | 11.7 /100 | #208 | Poor 11.4% |
| Paraguayans | 11.3 /100 | #209 | Poor 11.4% |
| Ugandans | 11.2 /100 | #210 | Poor 11.4% |