Bhutanese vs Immigrants from Central America Family Poverty
COMPARE
Bhutanese
Immigrants from Central America
Family Poverty
Family Poverty Comparison
Bhutanese
Immigrants from Central America
7.0%
FAMILY POVERTY
99.9/ 100
METRIC RATING
8th/ 347
METRIC RANK
12.1%
FAMILY POVERTY
0.0/ 100
METRIC RATING
312th/ 347
METRIC RANK
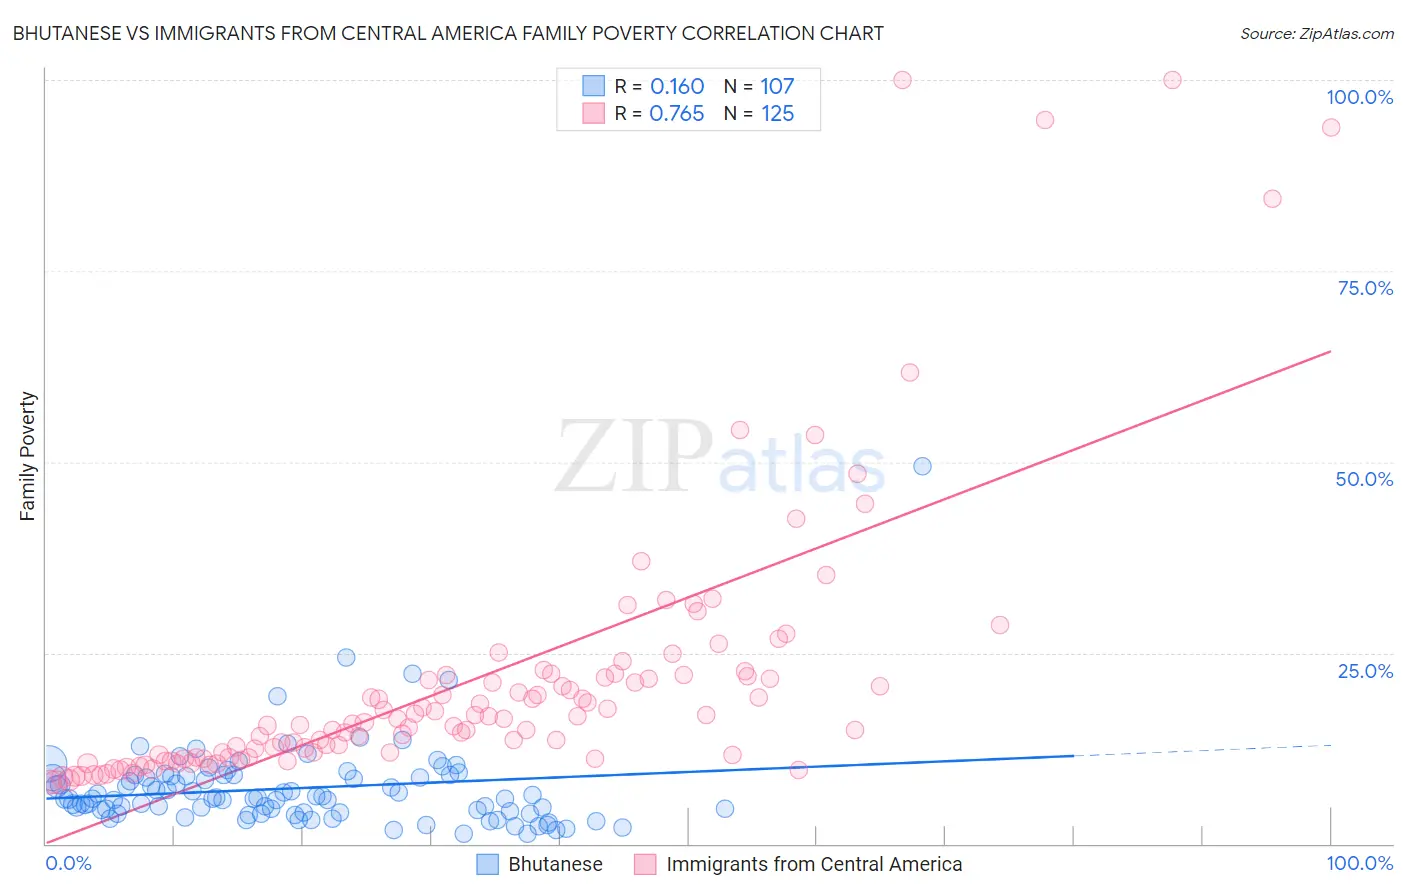
Bhutanese vs Immigrants from Central America Family Poverty Correlation Chart
The statistical analysis conducted on geographies consisting of 453,917,990 people shows a poor positive correlation between the proportion of Bhutanese and poverty level among families in the United States with a correlation coefficient (R) of 0.160 and weighted average of 7.0%. Similarly, the statistical analysis conducted on geographies consisting of 533,860,839 people shows a strong positive correlation between the proportion of Immigrants from Central America and poverty level among families in the United States with a correlation coefficient (R) of 0.765 and weighted average of 12.1%, a difference of 71.7%.
Family Poverty Correlation Summary
| Measurement | Bhutanese | Immigrants from Central America |
| Minimum | 1.3% | 8.0% |
| Maximum | 49.5% | 100.0% |
| Range | 48.2% | 92.0% |
| Mean | 7.3% | 21.3% |
| Median | 5.9% | 15.8% |
| Interquartile 25% (IQ1) | 4.1% | 11.3% |
| Interquartile 75% (IQ3) | 8.9% | 22.0% |
| Interquartile Range (IQR) | 4.9% | 10.7% |
| Standard Deviation (Sample) | 5.9% | 17.9% |
| Standard Deviation (Population) | 5.8% | 17.8% |
Similar Demographics by Family Poverty
Demographics Similar to Bhutanese by Family Poverty
In terms of family poverty, the demographic groups most similar to Bhutanese are Latvian (7.1%, a difference of 0.44%), Bulgarian (7.1%, a difference of 0.70%), Immigrants from Singapore (7.1%, a difference of 0.71%), Immigrants from Ireland (7.0%, a difference of 0.91%), and Maltese (7.1%, a difference of 1.0%).
| Demographics | Rating | Rank | Family Poverty |
| Immigrants | India | 100.0 /100 | #1 | Exceptional 6.2% |
| Chinese | 100.0 /100 | #2 | Exceptional 6.5% |
| Immigrants | Taiwan | 100.0 /100 | #3 | Exceptional 6.6% |
| Filipinos | 100.0 /100 | #4 | Exceptional 6.6% |
| Thais | 100.0 /100 | #5 | Exceptional 6.7% |
| Norwegians | 99.9 /100 | #6 | Exceptional 6.9% |
| Immigrants | Ireland | 99.9 /100 | #7 | Exceptional 7.0% |
| Bhutanese | 99.9 /100 | #8 | Exceptional 7.0% |
| Latvians | 99.9 /100 | #9 | Exceptional 7.1% |
| Bulgarians | 99.8 /100 | #10 | Exceptional 7.1% |
| Immigrants | Singapore | 99.8 /100 | #11 | Exceptional 7.1% |
| Maltese | 99.8 /100 | #12 | Exceptional 7.1% |
| Swedes | 99.8 /100 | #13 | Exceptional 7.1% |
| Iranians | 99.8 /100 | #14 | Exceptional 7.1% |
| Lithuanians | 99.8 /100 | #15 | Exceptional 7.2% |
Demographics Similar to Immigrants from Central America by Family Poverty
In terms of family poverty, the demographic groups most similar to Immigrants from Central America are Ute (12.1%, a difference of 0.38%), Immigrants from Caribbean (12.2%, a difference of 0.68%), Kiowa (12.2%, a difference of 1.2%), Hispanic or Latino (12.0%, a difference of 1.2%), and Immigrants from Guatemala (12.0%, a difference of 1.2%).
| Demographics | Rating | Rank | Family Poverty |
| Mexicans | 0.0 /100 | #305 | Tragic 11.8% |
| Cajuns | 0.0 /100 | #306 | Tragic 11.9% |
| Immigrants | Congo | 0.0 /100 | #307 | Tragic 11.9% |
| Seminole | 0.0 /100 | #308 | Tragic 11.9% |
| Hispanics or Latinos | 0.0 /100 | #309 | Tragic 12.0% |
| Immigrants | Guatemala | 0.0 /100 | #310 | Tragic 12.0% |
| Ute | 0.0 /100 | #311 | Tragic 12.1% |
| Immigrants | Central America | 0.0 /100 | #312 | Tragic 12.1% |
| Immigrants | Caribbean | 0.0 /100 | #313 | Tragic 12.2% |
| Kiowa | 0.0 /100 | #314 | Tragic 12.2% |
| Immigrants | Mexico | 0.0 /100 | #315 | Tragic 12.3% |
| Hondurans | 0.0 /100 | #316 | Tragic 12.4% |
| Immigrants | Grenada | 0.0 /100 | #317 | Tragic 12.4% |
| U.S. Virgin Islanders | 0.0 /100 | #318 | Tragic 12.4% |
| British West Indians | 0.0 /100 | #319 | Tragic 12.4% |