South American vs Immigrants from Syria Family Poverty
COMPARE
South American
Immigrants from Syria
Family Poverty
Family Poverty Comparison
South Americans
Immigrants from Syria
9.3%
FAMILY POVERTY
28.1/ 100
METRIC RATING
194th/ 347
METRIC RANK
9.0%
FAMILY POVERTY
47.5/ 100
METRIC RATING
176th/ 347
METRIC RANK
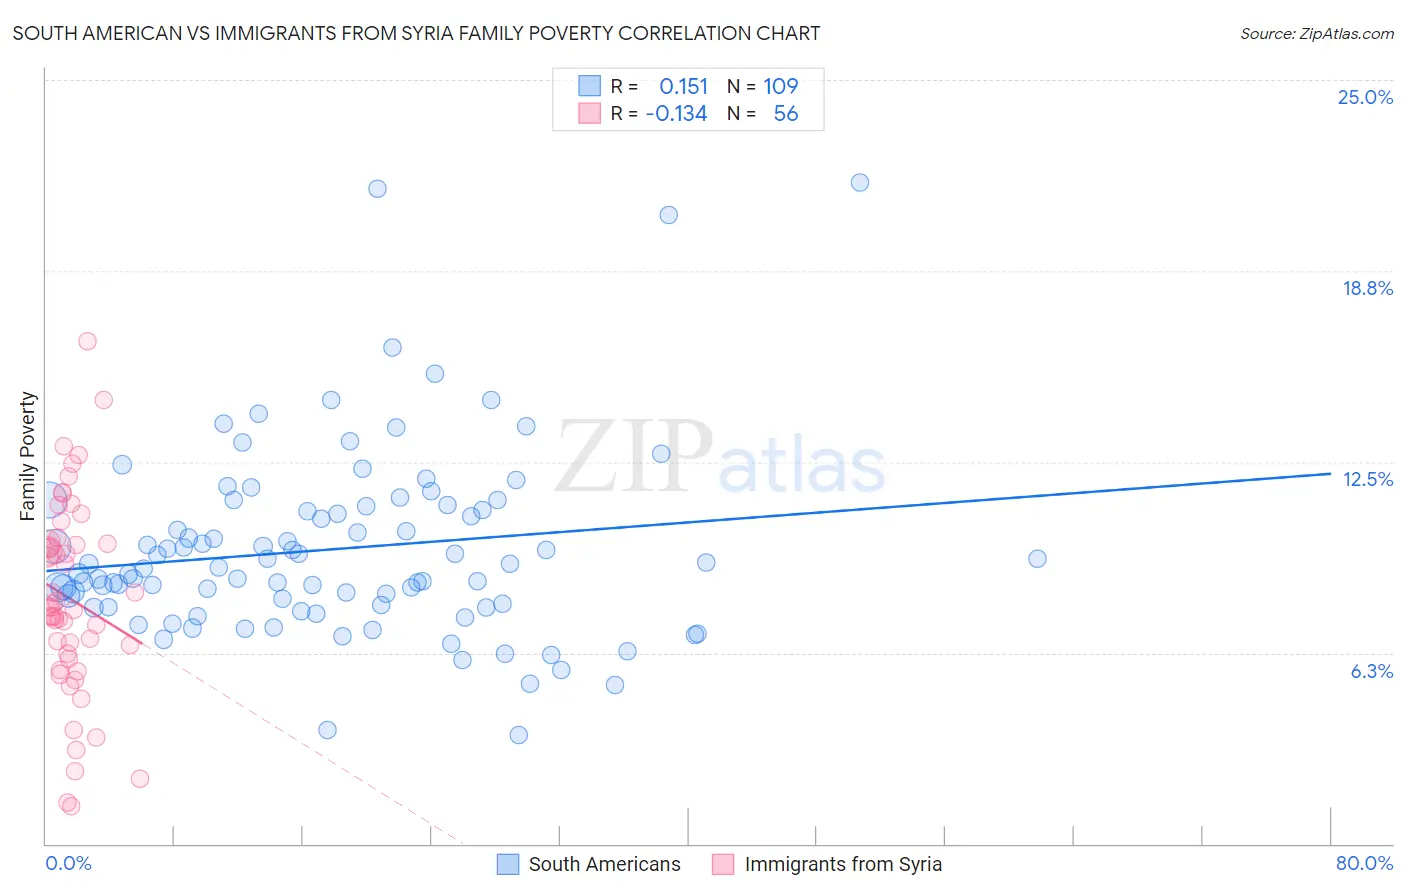
South American vs Immigrants from Syria Family Poverty Correlation Chart
The statistical analysis conducted on geographies consisting of 491,953,900 people shows a poor positive correlation between the proportion of South Americans and poverty level among families in the United States with a correlation coefficient (R) of 0.151 and weighted average of 9.3%. Similarly, the statistical analysis conducted on geographies consisting of 173,889,011 people shows a poor negative correlation between the proportion of Immigrants from Syria and poverty level among families in the United States with a correlation coefficient (R) of -0.134 and weighted average of 9.0%, a difference of 2.7%.
Family Poverty Correlation Summary
| Measurement | South American | Immigrants from Syria |
| Minimum | 3.6% | 1.2% |
| Maximum | 21.7% | 16.4% |
| Range | 18.1% | 15.2% |
| Mean | 9.6% | 8.0% |
| Median | 9.0% | 7.7% |
| Interquartile 25% (IQ1) | 7.8% | 6.2% |
| Interquartile 75% (IQ3) | 11.0% | 9.8% |
| Interquartile Range (IQR) | 3.2% | 3.7% |
| Standard Deviation (Sample) | 3.1% | 3.2% |
| Standard Deviation (Population) | 3.1% | 3.2% |
Demographics Similar to South Americans and Immigrants from Syria by Family Poverty
In terms of family poverty, the demographic groups most similar to South Americans are Immigrants from Western Asia (9.3%, a difference of 0.020%), Spanish (9.3%, a difference of 0.090%), Ugandan (9.3%, a difference of 0.10%), Venezuelan (9.3%, a difference of 0.12%), and Arab (9.2%, a difference of 0.52%). Similarly, the demographic groups most similar to Immigrants from Syria are Hawaiian (9.0%, a difference of 0.030%), Immigrants from Cameroon (9.0%, a difference of 0.040%), Costa Rican (9.0%, a difference of 0.24%), Immigrants from Iraq (9.1%, a difference of 0.41%), and Immigrants from Uganda (9.1%, a difference of 0.54%).
| Demographics | Rating | Rank | Family Poverty |
| Costa Ricans | 49.3 /100 | #175 | Average 9.0% |
| Immigrants | Syria | 47.5 /100 | #176 | Average 9.0% |
| Hawaiians | 47.2 /100 | #177 | Average 9.0% |
| Immigrants | Cameroon | 47.1 /100 | #178 | Average 9.0% |
| Immigrants | Iraq | 44.4 /100 | #179 | Average 9.1% |
| Immigrants | Uganda | 43.4 /100 | #180 | Average 9.1% |
| Hmong | 40.2 /100 | #181 | Average 9.1% |
| Immigrants | Morocco | 40.2 /100 | #182 | Average 9.1% |
| Uruguayans | 39.2 /100 | #183 | Fair 9.1% |
| South American Indians | 38.7 /100 | #184 | Fair 9.1% |
| Immigrants | Saudi Arabia | 38.6 /100 | #185 | Fair 9.1% |
| Colombians | 36.1 /100 | #186 | Fair 9.2% |
| Delaware | 35.4 /100 | #187 | Fair 9.2% |
| Immigrants | Kenya | 34.0 /100 | #188 | Fair 9.2% |
| Immigrants | Afghanistan | 32.1 /100 | #189 | Fair 9.2% |
| Arabs | 31.5 /100 | #190 | Fair 9.2% |
| Ugandans | 28.7 /100 | #191 | Fair 9.3% |
| Spanish | 28.7 /100 | #192 | Fair 9.3% |
| Immigrants | Western Asia | 28.2 /100 | #193 | Fair 9.3% |
| South Americans | 28.1 /100 | #194 | Fair 9.3% |
| Venezuelans | 27.4 /100 | #195 | Fair 9.3% |