Bermudan vs Dutch Child Poverty Among Girls Under 16
COMPARE
Bermudan
Dutch
Child Poverty Among Girls Under 16
Child Poverty Among Girls Under 16 Comparison
Bermudans
Dutch
18.1%
CHILD POVERTY AMONG GIRLS UNDER 16
2.8/ 100
METRIC RATING
224th/ 347
METRIC RANK
15.1%
CHILD POVERTY AMONG GIRLS UNDER 16
94.3/ 100
METRIC RATING
113th/ 347
METRIC RANK
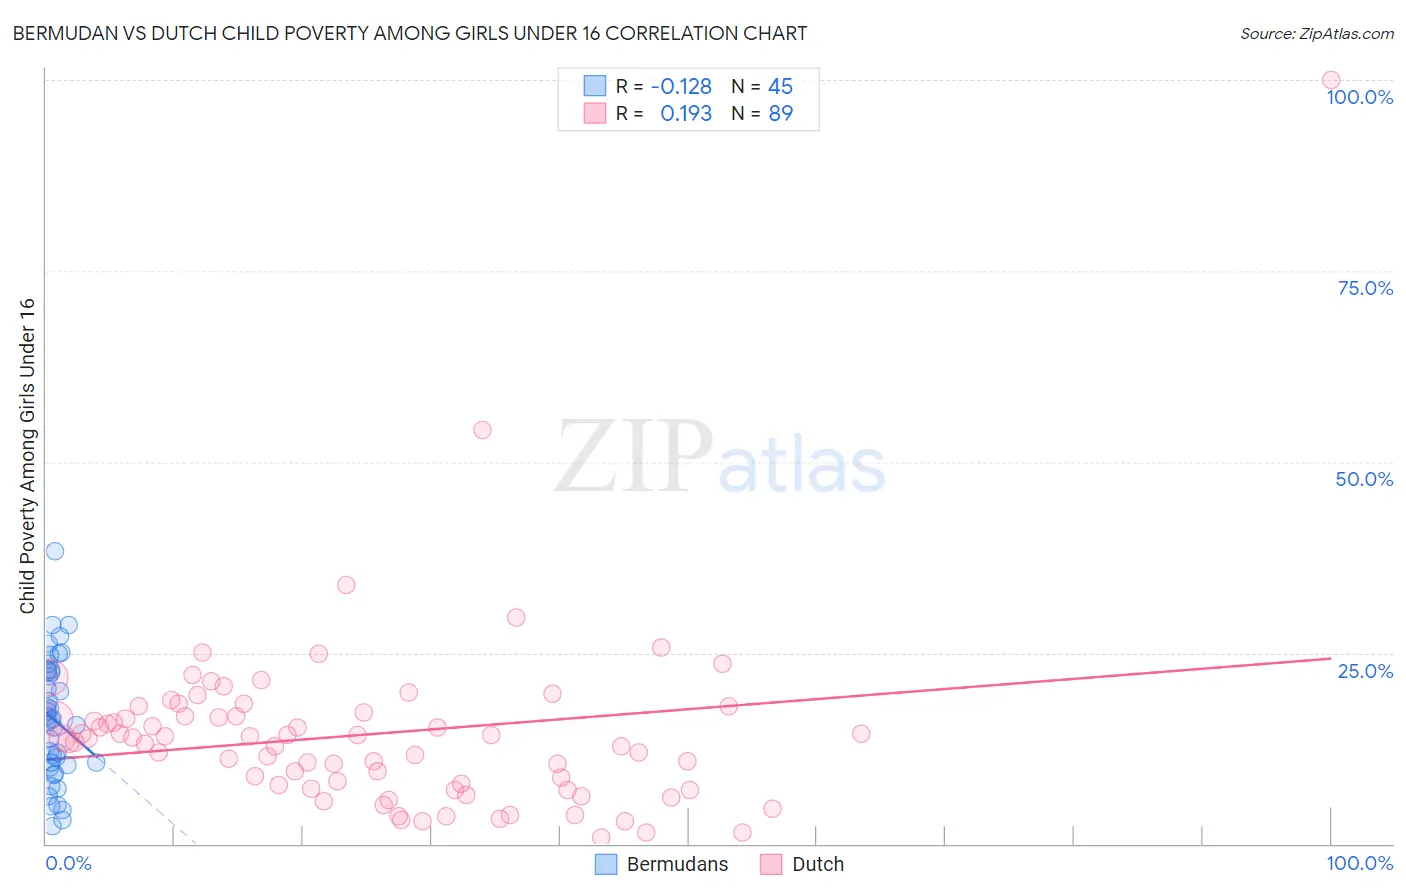
Bermudan vs Dutch Child Poverty Among Girls Under 16 Correlation Chart
The statistical analysis conducted on geographies consisting of 55,609,827 people shows a poor negative correlation between the proportion of Bermudans and poverty level among girls under the age of 16 in the United States with a correlation coefficient (R) of -0.128 and weighted average of 18.1%. Similarly, the statistical analysis conducted on geographies consisting of 533,855,440 people shows a poor positive correlation between the proportion of Dutch and poverty level among girls under the age of 16 in the United States with a correlation coefficient (R) of 0.193 and weighted average of 15.1%, a difference of 19.8%.
Child Poverty Among Girls Under 16 Correlation Summary
| Measurement | Bermudan | Dutch |
| Minimum | 2.4% | 0.74% |
| Maximum | 38.3% | 100.0% |
| Range | 35.9% | 99.3% |
| Mean | 16.2% | 14.3% |
| Median | 16.2% | 13.8% |
| Interquartile 25% (IQ1) | 10.2% | 7.4% |
| Interquartile 75% (IQ3) | 22.7% | 17.0% |
| Interquartile Range (IQR) | 12.5% | 9.5% |
| Standard Deviation (Sample) | 8.1% | 12.2% |
| Standard Deviation (Population) | 8.0% | 12.1% |
Similar Demographics by Child Poverty Among Girls Under 16
Demographics Similar to Bermudans by Child Poverty Among Girls Under 16
In terms of child poverty among girls under 16, the demographic groups most similar to Bermudans are Immigrants from Armenia (18.1%, a difference of 0.070%), Immigrants from Cambodia (18.1%, a difference of 0.080%), Immigrants from Africa (18.2%, a difference of 0.10%), Nicaraguan (18.2%, a difference of 0.42%), and Immigrants from Micronesia (18.0%, a difference of 0.60%).
| Demographics | Rating | Rank | Child Poverty Among Girls Under 16 |
| Japanese | 5.3 /100 | #217 | Tragic 17.8% |
| Alaska Natives | 5.2 /100 | #218 | Tragic 17.8% |
| Immigrants | Panama | 4.7 /100 | #219 | Tragic 17.9% |
| Cubans | 4.1 /100 | #220 | Tragic 18.0% |
| Immigrants | Micronesia | 3.5 /100 | #221 | Tragic 18.0% |
| Immigrants | Cambodia | 2.9 /100 | #222 | Tragic 18.1% |
| Immigrants | Armenia | 2.9 /100 | #223 | Tragic 18.1% |
| Bermudans | 2.8 /100 | #224 | Tragic 18.1% |
| Immigrants | Africa | 2.7 /100 | #225 | Tragic 18.2% |
| Nicaraguans | 2.4 /100 | #226 | Tragic 18.2% |
| Immigrants | Nonimmigrants | 2.0 /100 | #227 | Tragic 18.3% |
| Alaskan Athabascans | 2.0 /100 | #228 | Tragic 18.3% |
| Ghanaians | 1.4 /100 | #229 | Tragic 18.5% |
| Osage | 1.3 /100 | #230 | Tragic 18.5% |
| Cree | 1.3 /100 | #231 | Tragic 18.5% |
Demographics Similar to Dutch by Child Poverty Among Girls Under 16
In terms of child poverty among girls under 16, the demographic groups most similar to Dutch are Immigrants from Kazakhstan (15.1%, a difference of 0.020%), Sri Lankan (15.2%, a difference of 0.13%), Palestinian (15.1%, a difference of 0.16%), Belgian (15.2%, a difference of 0.19%), and Immigrants from Croatia (15.1%, a difference of 0.20%).
| Demographics | Rating | Rank | Child Poverty Among Girls Under 16 |
| Chileans | 95.1 /100 | #106 | Exceptional 15.1% |
| Immigrants | Ukraine | 95.0 /100 | #107 | Exceptional 15.1% |
| Immigrants | Brazil | 94.9 /100 | #108 | Exceptional 15.1% |
| Serbians | 94.8 /100 | #109 | Exceptional 15.1% |
| Immigrants | Croatia | 94.6 /100 | #110 | Exceptional 15.1% |
| Palestinians | 94.5 /100 | #111 | Exceptional 15.1% |
| Immigrants | Kazakhstan | 94.3 /100 | #112 | Exceptional 15.1% |
| Dutch | 94.3 /100 | #113 | Exceptional 15.1% |
| Sri Lankans | 94.0 /100 | #114 | Exceptional 15.2% |
| Belgians | 93.9 /100 | #115 | Exceptional 15.2% |
| Immigrants | Denmark | 93.3 /100 | #116 | Exceptional 15.2% |
| Immigrants | North Macedonia | 93.1 /100 | #117 | Exceptional 15.2% |
| Immigrants | Southern Europe | 92.7 /100 | #118 | Exceptional 15.3% |
| Immigrants | Zimbabwe | 92.5 /100 | #119 | Exceptional 15.3% |
| Pakistanis | 92.3 /100 | #120 | Exceptional 15.3% |