Bermudan vs Colombian Child Poverty Among Girls Under 16
COMPARE
Bermudan
Colombian
Child Poverty Among Girls Under 16
Child Poverty Among Girls Under 16 Comparison
Bermudans
Colombians
18.1%
CHILD POVERTY AMONG GIRLS UNDER 16
2.8/ 100
METRIC RATING
224th/ 347
METRIC RANK
15.9%
CHILD POVERTY AMONG GIRLS UNDER 16
76.1/ 100
METRIC RATING
157th/ 347
METRIC RANK
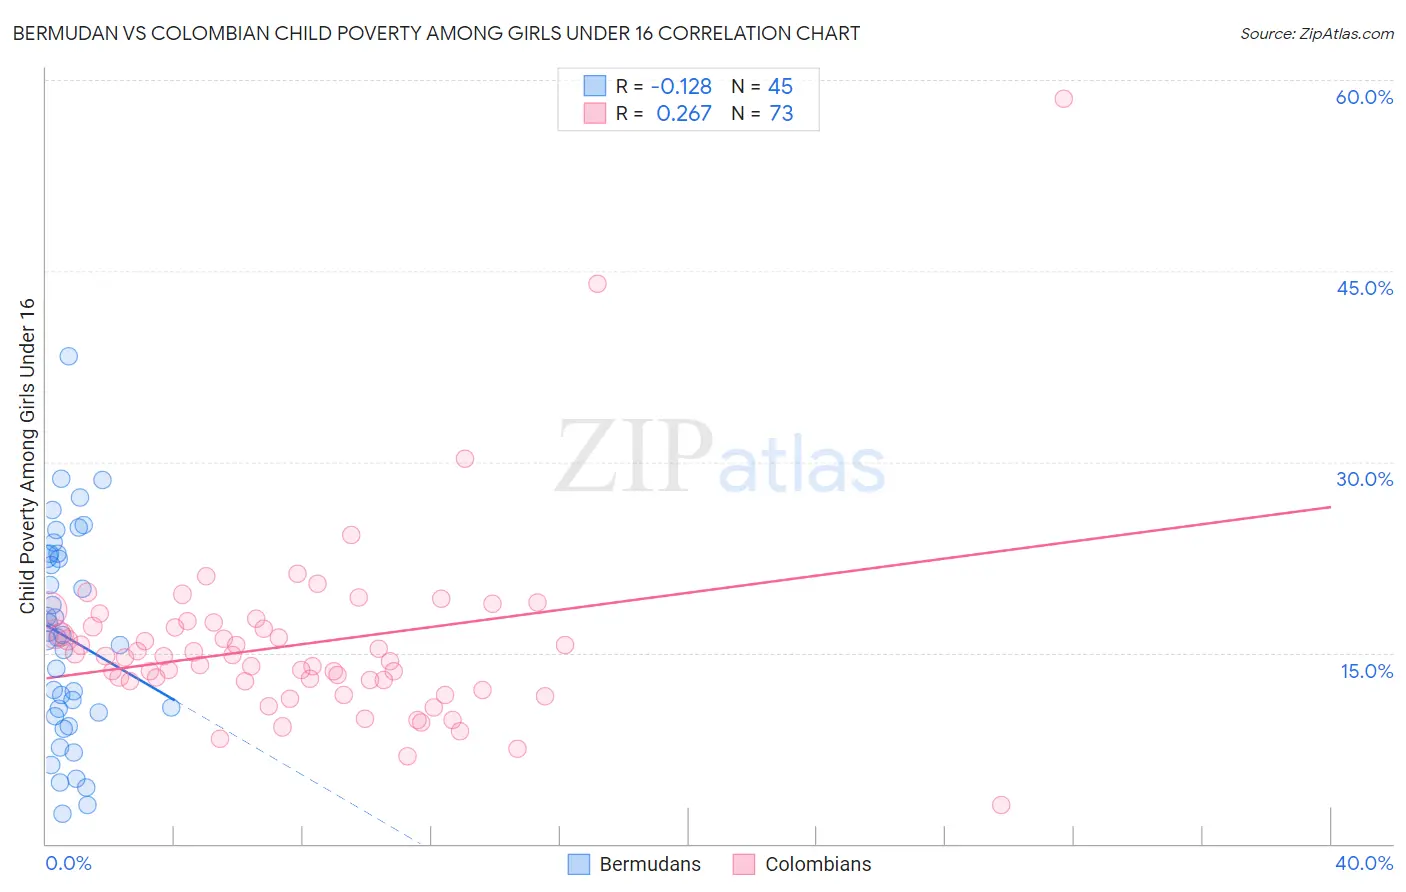
Bermudan vs Colombian Child Poverty Among Girls Under 16 Correlation Chart
The statistical analysis conducted on geographies consisting of 55,609,827 people shows a poor negative correlation between the proportion of Bermudans and poverty level among girls under the age of 16 in the United States with a correlation coefficient (R) of -0.128 and weighted average of 18.1%. Similarly, the statistical analysis conducted on geographies consisting of 411,792,249 people shows a weak positive correlation between the proportion of Colombians and poverty level among girls under the age of 16 in the United States with a correlation coefficient (R) of 0.267 and weighted average of 15.9%, a difference of 13.9%.
Child Poverty Among Girls Under 16 Correlation Summary
| Measurement | Bermudan | Colombian |
| Minimum | 2.4% | 3.1% |
| Maximum | 38.3% | 58.6% |
| Range | 35.9% | 55.5% |
| Mean | 16.2% | 15.7% |
| Median | 16.2% | 14.7% |
| Interquartile 25% (IQ1) | 10.2% | 12.8% |
| Interquartile 75% (IQ3) | 22.7% | 17.2% |
| Interquartile Range (IQR) | 12.5% | 4.4% |
| Standard Deviation (Sample) | 8.1% | 7.4% |
| Standard Deviation (Population) | 8.0% | 7.3% |
Similar Demographics by Child Poverty Among Girls Under 16
Demographics Similar to Bermudans by Child Poverty Among Girls Under 16
In terms of child poverty among girls under 16, the demographic groups most similar to Bermudans are Immigrants from Armenia (18.1%, a difference of 0.070%), Immigrants from Cambodia (18.1%, a difference of 0.080%), Immigrants from Africa (18.2%, a difference of 0.10%), Nicaraguan (18.2%, a difference of 0.42%), and Immigrants from Micronesia (18.0%, a difference of 0.60%).
| Demographics | Rating | Rank | Child Poverty Among Girls Under 16 |
| Japanese | 5.3 /100 | #217 | Tragic 17.8% |
| Alaska Natives | 5.2 /100 | #218 | Tragic 17.8% |
| Immigrants | Panama | 4.7 /100 | #219 | Tragic 17.9% |
| Cubans | 4.1 /100 | #220 | Tragic 18.0% |
| Immigrants | Micronesia | 3.5 /100 | #221 | Tragic 18.0% |
| Immigrants | Cambodia | 2.9 /100 | #222 | Tragic 18.1% |
| Immigrants | Armenia | 2.9 /100 | #223 | Tragic 18.1% |
| Bermudans | 2.8 /100 | #224 | Tragic 18.1% |
| Immigrants | Africa | 2.7 /100 | #225 | Tragic 18.2% |
| Nicaraguans | 2.4 /100 | #226 | Tragic 18.2% |
| Immigrants | Nonimmigrants | 2.0 /100 | #227 | Tragic 18.3% |
| Alaskan Athabascans | 2.0 /100 | #228 | Tragic 18.3% |
| Ghanaians | 1.4 /100 | #229 | Tragic 18.5% |
| Osage | 1.3 /100 | #230 | Tragic 18.5% |
| Cree | 1.3 /100 | #231 | Tragic 18.5% |
Demographics Similar to Colombians by Child Poverty Among Girls Under 16
In terms of child poverty among girls under 16, the demographic groups most similar to Colombians are Immigrants from Fiji (15.9%, a difference of 0.0%), Syrian (15.9%, a difference of 0.10%), Immigrants from Chile (15.9%, a difference of 0.11%), Guamanian/Chamorro (15.9%, a difference of 0.12%), and Slovak (15.9%, a difference of 0.13%).
| Demographics | Rating | Rank | Child Poverty Among Girls Under 16 |
| Immigrants | Albania | 80.7 /100 | #150 | Excellent 15.8% |
| Venezuelans | 80.1 /100 | #151 | Excellent 15.8% |
| Immigrants | Kuwait | 79.4 /100 | #152 | Good 15.8% |
| Immigrants | Nepal | 78.5 /100 | #153 | Good 15.9% |
| Immigrants | Chile | 76.7 /100 | #154 | Good 15.9% |
| Syrians | 76.7 /100 | #155 | Good 15.9% |
| Immigrants | Fiji | 76.1 /100 | #156 | Good 15.9% |
| Colombians | 76.1 /100 | #157 | Good 15.9% |
| Guamanians/Chamorros | 75.3 /100 | #158 | Good 15.9% |
| Slovaks | 75.2 /100 | #159 | Good 15.9% |
| French | 72.8 /100 | #160 | Good 16.0% |
| Immigrants | Northern Africa | 72.0 /100 | #161 | Good 16.0% |
| French Canadians | 68.7 /100 | #162 | Good 16.1% |
| Immigrants | Oceania | 68.4 /100 | #163 | Good 16.1% |
| Immigrants | Colombia | 67.8 /100 | #164 | Good 16.1% |