Estonian vs Dutch Child Poverty Among Girls Under 16
COMPARE
Estonian
Dutch
Child Poverty Among Girls Under 16
Child Poverty Among Girls Under 16 Comparison
Estonians
Dutch
14.3%
CHILD POVERTY AMONG GIRLS UNDER 16
98.9/ 100
METRIC RATING
54th/ 347
METRIC RANK
15.1%
CHILD POVERTY AMONG GIRLS UNDER 16
94.3/ 100
METRIC RATING
113th/ 347
METRIC RANK
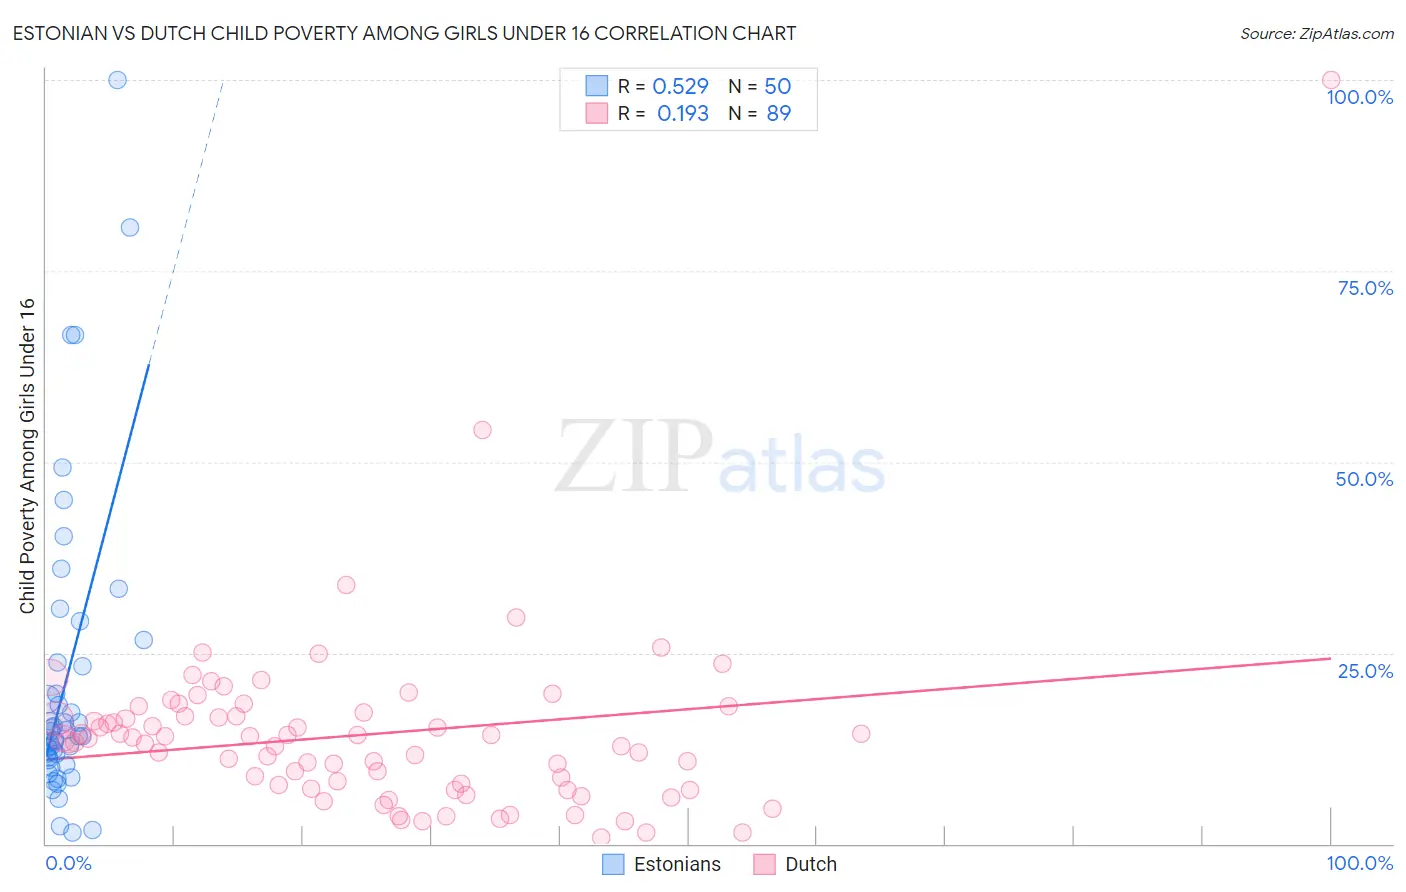
Estonian vs Dutch Child Poverty Among Girls Under 16 Correlation Chart
The statistical analysis conducted on geographies consisting of 122,015,840 people shows a substantial positive correlation between the proportion of Estonians and poverty level among girls under the age of 16 in the United States with a correlation coefficient (R) of 0.529 and weighted average of 14.3%. Similarly, the statistical analysis conducted on geographies consisting of 533,855,440 people shows a poor positive correlation between the proportion of Dutch and poverty level among girls under the age of 16 in the United States with a correlation coefficient (R) of 0.193 and weighted average of 15.1%, a difference of 5.6%.
Child Poverty Among Girls Under 16 Correlation Summary
| Measurement | Estonian | Dutch |
| Minimum | 1.4% | 0.74% |
| Maximum | 100.0% | 100.0% |
| Range | 98.6% | 99.3% |
| Mean | 21.6% | 14.3% |
| Median | 14.4% | 13.8% |
| Interquartile 25% (IQ1) | 11.1% | 7.4% |
| Interquartile 75% (IQ3) | 23.7% | 17.0% |
| Interquartile Range (IQR) | 12.7% | 9.5% |
| Standard Deviation (Sample) | 20.2% | 12.2% |
| Standard Deviation (Population) | 20.0% | 12.1% |
Similar Demographics by Child Poverty Among Girls Under 16
Demographics Similar to Estonians by Child Poverty Among Girls Under 16
In terms of child poverty among girls under 16, the demographic groups most similar to Estonians are Immigrants from Romania (14.3%, a difference of 0.040%), Immigrants from Indonesia (14.4%, a difference of 0.12%), Immigrants from Serbia (14.4%, a difference of 0.16%), Immigrants from Bulgaria (14.4%, a difference of 0.25%), and Zimbabwean (14.4%, a difference of 0.31%).
| Demographics | Rating | Rank | Child Poverty Among Girls Under 16 |
| Immigrants | Czechoslovakia | 99.3 /100 | #47 | Exceptional 14.2% |
| Czechs | 99.3 /100 | #48 | Exceptional 14.2% |
| Greeks | 99.2 /100 | #49 | Exceptional 14.2% |
| Immigrants | Israel | 99.2 /100 | #50 | Exceptional 14.2% |
| Immigrants | Pakistan | 99.1 /100 | #51 | Exceptional 14.2% |
| Italians | 99.1 /100 | #52 | Exceptional 14.3% |
| Luxembourgers | 99.0 /100 | #53 | Exceptional 14.3% |
| Estonians | 98.9 /100 | #54 | Exceptional 14.3% |
| Immigrants | Romania | 98.9 /100 | #55 | Exceptional 14.3% |
| Immigrants | Indonesia | 98.9 /100 | #56 | Exceptional 14.4% |
| Immigrants | Serbia | 98.9 /100 | #57 | Exceptional 14.4% |
| Immigrants | Bulgaria | 98.8 /100 | #58 | Exceptional 14.4% |
| Zimbabweans | 98.8 /100 | #59 | Exceptional 14.4% |
| Poles | 98.7 /100 | #60 | Exceptional 14.4% |
| Cambodians | 98.7 /100 | #61 | Exceptional 14.4% |
Demographics Similar to Dutch by Child Poverty Among Girls Under 16
In terms of child poverty among girls under 16, the demographic groups most similar to Dutch are Immigrants from Kazakhstan (15.1%, a difference of 0.020%), Sri Lankan (15.2%, a difference of 0.13%), Palestinian (15.1%, a difference of 0.16%), Belgian (15.2%, a difference of 0.19%), and Immigrants from Croatia (15.1%, a difference of 0.20%).
| Demographics | Rating | Rank | Child Poverty Among Girls Under 16 |
| Chileans | 95.1 /100 | #106 | Exceptional 15.1% |
| Immigrants | Ukraine | 95.0 /100 | #107 | Exceptional 15.1% |
| Immigrants | Brazil | 94.9 /100 | #108 | Exceptional 15.1% |
| Serbians | 94.8 /100 | #109 | Exceptional 15.1% |
| Immigrants | Croatia | 94.6 /100 | #110 | Exceptional 15.1% |
| Palestinians | 94.5 /100 | #111 | Exceptional 15.1% |
| Immigrants | Kazakhstan | 94.3 /100 | #112 | Exceptional 15.1% |
| Dutch | 94.3 /100 | #113 | Exceptional 15.1% |
| Sri Lankans | 94.0 /100 | #114 | Exceptional 15.2% |
| Belgians | 93.9 /100 | #115 | Exceptional 15.2% |
| Immigrants | Denmark | 93.3 /100 | #116 | Exceptional 15.2% |
| Immigrants | North Macedonia | 93.1 /100 | #117 | Exceptional 15.2% |
| Immigrants | Southern Europe | 92.7 /100 | #118 | Exceptional 15.3% |
| Immigrants | Zimbabwe | 92.5 /100 | #119 | Exceptional 15.3% |
| Pakistanis | 92.3 /100 | #120 | Exceptional 15.3% |