Bermudan vs Aleut Single Mother Poverty
COMPARE
Bermudan
Aleut
Single Mother Poverty
Single Mother Poverty Comparison
Bermudans
Aleuts
30.6%
SINGLE MOTHER POVERTY
1.6/ 100
METRIC RATING
243rd/ 347
METRIC RANK
32.9%
SINGLE MOTHER POVERTY
0.0/ 100
METRIC RATING
293rd/ 347
METRIC RANK
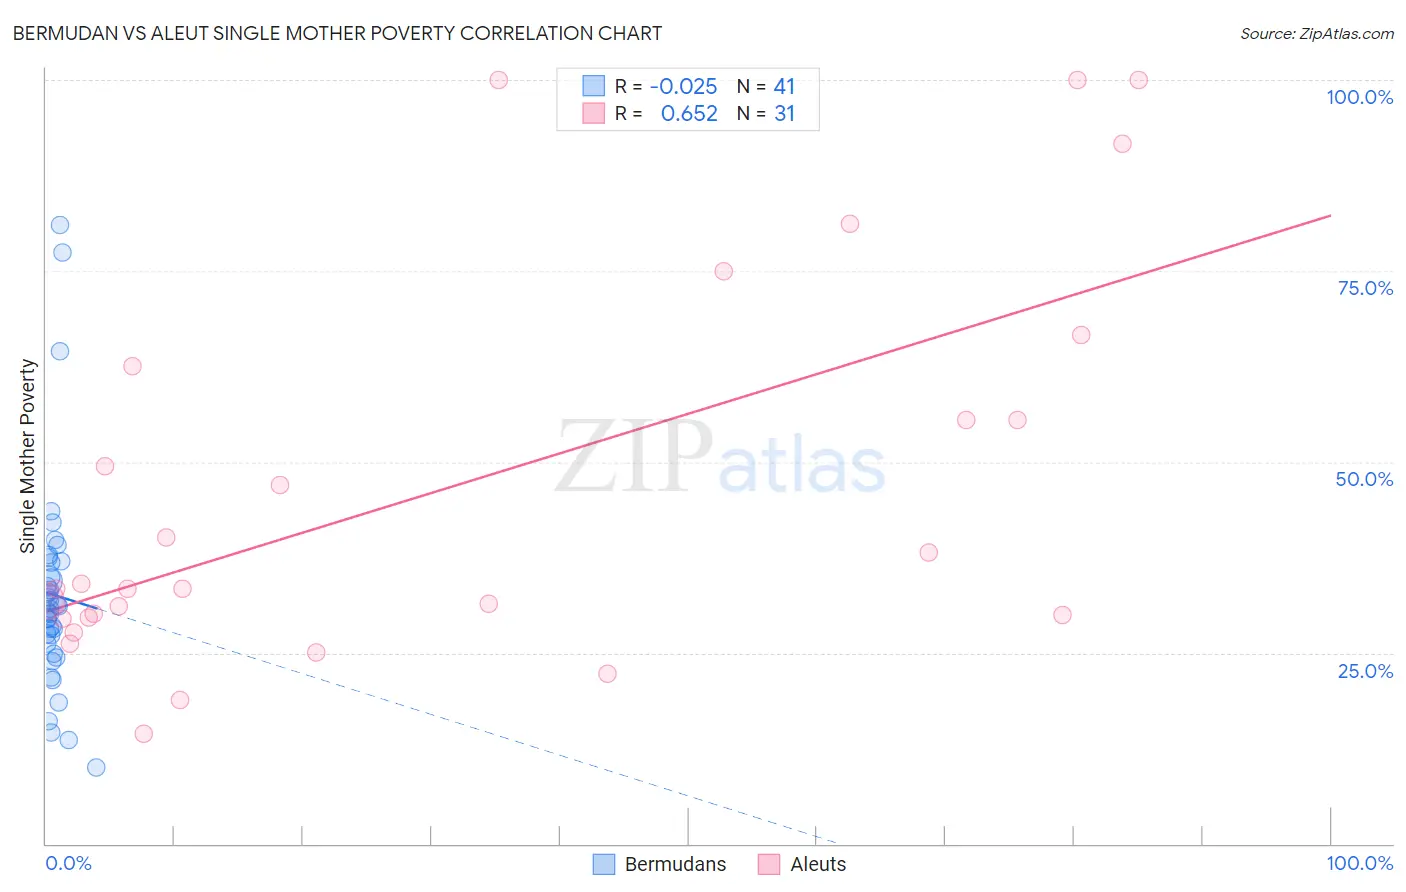
Bermudan vs Aleut Single Mother Poverty Correlation Chart
The statistical analysis conducted on geographies consisting of 55,530,173 people shows no correlation between the proportion of Bermudans and poverty level among single mothers in the United States with a correlation coefficient (R) of -0.025 and weighted average of 30.6%. Similarly, the statistical analysis conducted on geographies consisting of 61,416,159 people shows a significant positive correlation between the proportion of Aleuts and poverty level among single mothers in the United States with a correlation coefficient (R) of 0.652 and weighted average of 32.9%, a difference of 7.6%.
Single Mother Poverty Correlation Summary
| Measurement | Bermudan | Aleut |
| Minimum | 10.0% | 14.4% |
| Maximum | 81.0% | 100.0% |
| Range | 71.0% | 85.6% |
| Mean | 32.6% | 46.6% |
| Median | 30.7% | 33.4% |
| Interquartile 25% (IQ1) | 25.5% | 29.6% |
| Interquartile 75% (IQ3) | 36.9% | 62.5% |
| Interquartile Range (IQR) | 11.3% | 32.9% |
| Standard Deviation (Sample) | 14.2% | 25.6% |
| Standard Deviation (Population) | 14.0% | 25.2% |
Similar Demographics by Single Mother Poverty
Demographics Similar to Bermudans by Single Mother Poverty
In terms of single mother poverty, the demographic groups most similar to Bermudans are Immigrants from Burma/Myanmar (30.6%, a difference of 0.080%), Immigrants from Laos (30.6%, a difference of 0.10%), Salvadoran (30.6%, a difference of 0.15%), French (30.7%, a difference of 0.22%), and Barbadian (30.7%, a difference of 0.23%).
| Demographics | Rating | Rank | Single Mother Poverty |
| Welsh | 3.2 /100 | #236 | Tragic 30.4% |
| Immigrants | St. Vincent and the Grenadines | 3.1 /100 | #237 | Tragic 30.4% |
| Slovaks | 2.8 /100 | #238 | Tragic 30.4% |
| Immigrants | Portugal | 2.1 /100 | #239 | Tragic 30.5% |
| Salvadorans | 1.8 /100 | #240 | Tragic 30.6% |
| Immigrants | Laos | 1.8 /100 | #241 | Tragic 30.6% |
| Immigrants | Burma/Myanmar | 1.7 /100 | #242 | Tragic 30.6% |
| Bermudans | 1.6 /100 | #243 | Tragic 30.6% |
| French | 1.3 /100 | #244 | Tragic 30.7% |
| Barbadians | 1.3 /100 | #245 | Tragic 30.7% |
| Ecuadorians | 0.9 /100 | #246 | Tragic 30.8% |
| West Indians | 0.9 /100 | #247 | Tragic 30.8% |
| French Canadians | 0.9 /100 | #248 | Tragic 30.8% |
| Cape Verdeans | 0.8 /100 | #249 | Tragic 30.8% |
| Vietnamese | 0.7 /100 | #250 | Tragic 30.9% |
Demographics Similar to Aleuts by Single Mother Poverty
In terms of single mother poverty, the demographic groups most similar to Aleuts are Shoshone (32.9%, a difference of 0.030%), Guatemalan (32.9%, a difference of 0.050%), French American Indian (33.1%, a difference of 0.63%), Yaqui (33.1%, a difference of 0.66%), and Blackfeet (33.2%, a difference of 0.82%).
| Demographics | Rating | Rank | Single Mother Poverty |
| Yup'ik | 0.0 /100 | #286 | Tragic 32.5% |
| Immigrants | Dominica | 0.0 /100 | #287 | Tragic 32.5% |
| Somalis | 0.0 /100 | #288 | Tragic 32.6% |
| U.S. Virgin Islanders | 0.0 /100 | #289 | Tragic 32.6% |
| Osage | 0.0 /100 | #290 | Tragic 32.6% |
| Guatemalans | 0.0 /100 | #291 | Tragic 32.9% |
| Shoshone | 0.0 /100 | #292 | Tragic 32.9% |
| Aleuts | 0.0 /100 | #293 | Tragic 32.9% |
| French American Indians | 0.0 /100 | #294 | Tragic 33.1% |
| Yaqui | 0.0 /100 | #295 | Tragic 33.1% |
| Blackfeet | 0.0 /100 | #296 | Tragic 33.2% |
| Pennsylvania Germans | 0.0 /100 | #297 | Tragic 33.2% |
| Africans | 0.0 /100 | #298 | Tragic 33.3% |
| Immigrants | Guatemala | 0.0 /100 | #299 | Tragic 33.3% |
| Hispanics or Latinos | 0.0 /100 | #300 | Tragic 33.3% |