Immigrants from Nepal vs Aleut Single Mother Poverty
COMPARE
Immigrants from Nepal
Aleut
Single Mother Poverty
Single Mother Poverty Comparison
Immigrants from Nepal
Aleuts
27.9%
SINGLE MOTHER POVERTY
97.2/ 100
METRIC RATING
98th/ 347
METRIC RANK
32.9%
SINGLE MOTHER POVERTY
0.0/ 100
METRIC RATING
293rd/ 347
METRIC RANK
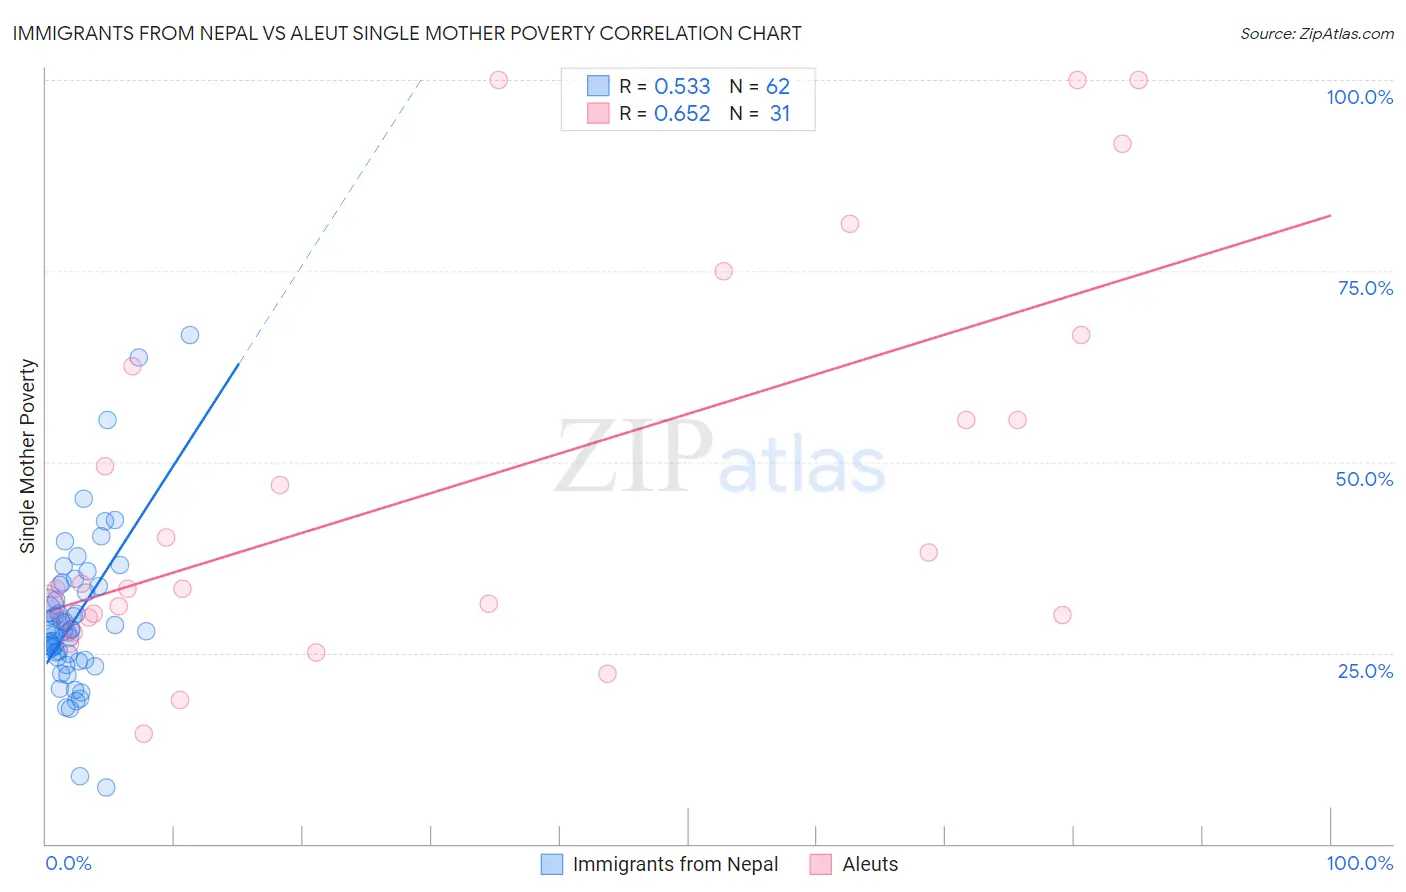
Immigrants from Nepal vs Aleut Single Mother Poverty Correlation Chart
The statistical analysis conducted on geographies consisting of 184,396,639 people shows a substantial positive correlation between the proportion of Immigrants from Nepal and poverty level among single mothers in the United States with a correlation coefficient (R) of 0.533 and weighted average of 27.9%. Similarly, the statistical analysis conducted on geographies consisting of 61,416,159 people shows a significant positive correlation between the proportion of Aleuts and poverty level among single mothers in the United States with a correlation coefficient (R) of 0.652 and weighted average of 32.9%, a difference of 17.9%.
Single Mother Poverty Correlation Summary
| Measurement | Immigrants from Nepal | Aleut |
| Minimum | 7.4% | 14.4% |
| Maximum | 66.7% | 100.0% |
| Range | 59.3% | 85.6% |
| Mean | 29.5% | 46.6% |
| Median | 27.9% | 33.4% |
| Interquartile 25% (IQ1) | 24.4% | 29.6% |
| Interquartile 75% (IQ3) | 33.7% | 62.5% |
| Interquartile Range (IQR) | 9.3% | 32.9% |
| Standard Deviation (Sample) | 10.3% | 25.6% |
| Standard Deviation (Population) | 10.2% | 25.2% |
Similar Demographics by Single Mother Poverty
Demographics Similar to Immigrants from Nepal by Single Mother Poverty
In terms of single mother poverty, the demographic groups most similar to Immigrants from Nepal are Immigrants from Brazil (27.9%, a difference of 0.010%), Immigrants from Netherlands (27.9%, a difference of 0.010%), Immigrants from Iraq (27.9%, a difference of 0.050%), Zimbabwean (27.9%, a difference of 0.060%), and Pakistani (28.0%, a difference of 0.12%).
| Demographics | Rating | Rank | Single Mother Poverty |
| Immigrants | Albania | 98.0 /100 | #91 | Exceptional 27.8% |
| Estonians | 97.9 /100 | #92 | Exceptional 27.8% |
| Romanians | 97.8 /100 | #93 | Exceptional 27.8% |
| Albanians | 97.6 /100 | #94 | Exceptional 27.9% |
| Chileans | 97.5 /100 | #95 | Exceptional 27.9% |
| Immigrants | Iraq | 97.3 /100 | #96 | Exceptional 27.9% |
| Immigrants | Brazil | 97.2 /100 | #97 | Exceptional 27.9% |
| Immigrants | Nepal | 97.2 /100 | #98 | Exceptional 27.9% |
| Immigrants | Netherlands | 97.2 /100 | #99 | Exceptional 27.9% |
| Zimbabweans | 97.1 /100 | #100 | Exceptional 27.9% |
| Pakistanis | 96.9 /100 | #101 | Exceptional 28.0% |
| Immigrants | Croatia | 96.7 /100 | #102 | Exceptional 28.0% |
| Immigrants | Northern Africa | 96.6 /100 | #103 | Exceptional 28.0% |
| Italians | 96.6 /100 | #104 | Exceptional 28.0% |
| Israelis | 96.5 /100 | #105 | Exceptional 28.0% |
Demographics Similar to Aleuts by Single Mother Poverty
In terms of single mother poverty, the demographic groups most similar to Aleuts are Shoshone (32.9%, a difference of 0.030%), Guatemalan (32.9%, a difference of 0.050%), French American Indian (33.1%, a difference of 0.63%), Yaqui (33.1%, a difference of 0.66%), and Blackfeet (33.2%, a difference of 0.82%).
| Demographics | Rating | Rank | Single Mother Poverty |
| Yup'ik | 0.0 /100 | #286 | Tragic 32.5% |
| Immigrants | Dominica | 0.0 /100 | #287 | Tragic 32.5% |
| Somalis | 0.0 /100 | #288 | Tragic 32.6% |
| U.S. Virgin Islanders | 0.0 /100 | #289 | Tragic 32.6% |
| Osage | 0.0 /100 | #290 | Tragic 32.6% |
| Guatemalans | 0.0 /100 | #291 | Tragic 32.9% |
| Shoshone | 0.0 /100 | #292 | Tragic 32.9% |
| Aleuts | 0.0 /100 | #293 | Tragic 32.9% |
| French American Indians | 0.0 /100 | #294 | Tragic 33.1% |
| Yaqui | 0.0 /100 | #295 | Tragic 33.1% |
| Blackfeet | 0.0 /100 | #296 | Tragic 33.2% |
| Pennsylvania Germans | 0.0 /100 | #297 | Tragic 33.2% |
| Africans | 0.0 /100 | #298 | Tragic 33.3% |
| Immigrants | Guatemala | 0.0 /100 | #299 | Tragic 33.3% |
| Hispanics or Latinos | 0.0 /100 | #300 | Tragic 33.3% |