Immigrants from Nigeria vs Aleut Single Mother Poverty
COMPARE
Immigrants from Nigeria
Aleut
Single Mother Poverty
Single Mother Poverty Comparison
Immigrants from Nigeria
Aleuts
28.9%
SINGLE MOTHER POVERTY
65.9/ 100
METRIC RATING
163rd/ 347
METRIC RANK
32.9%
SINGLE MOTHER POVERTY
0.0/ 100
METRIC RATING
293rd/ 347
METRIC RANK
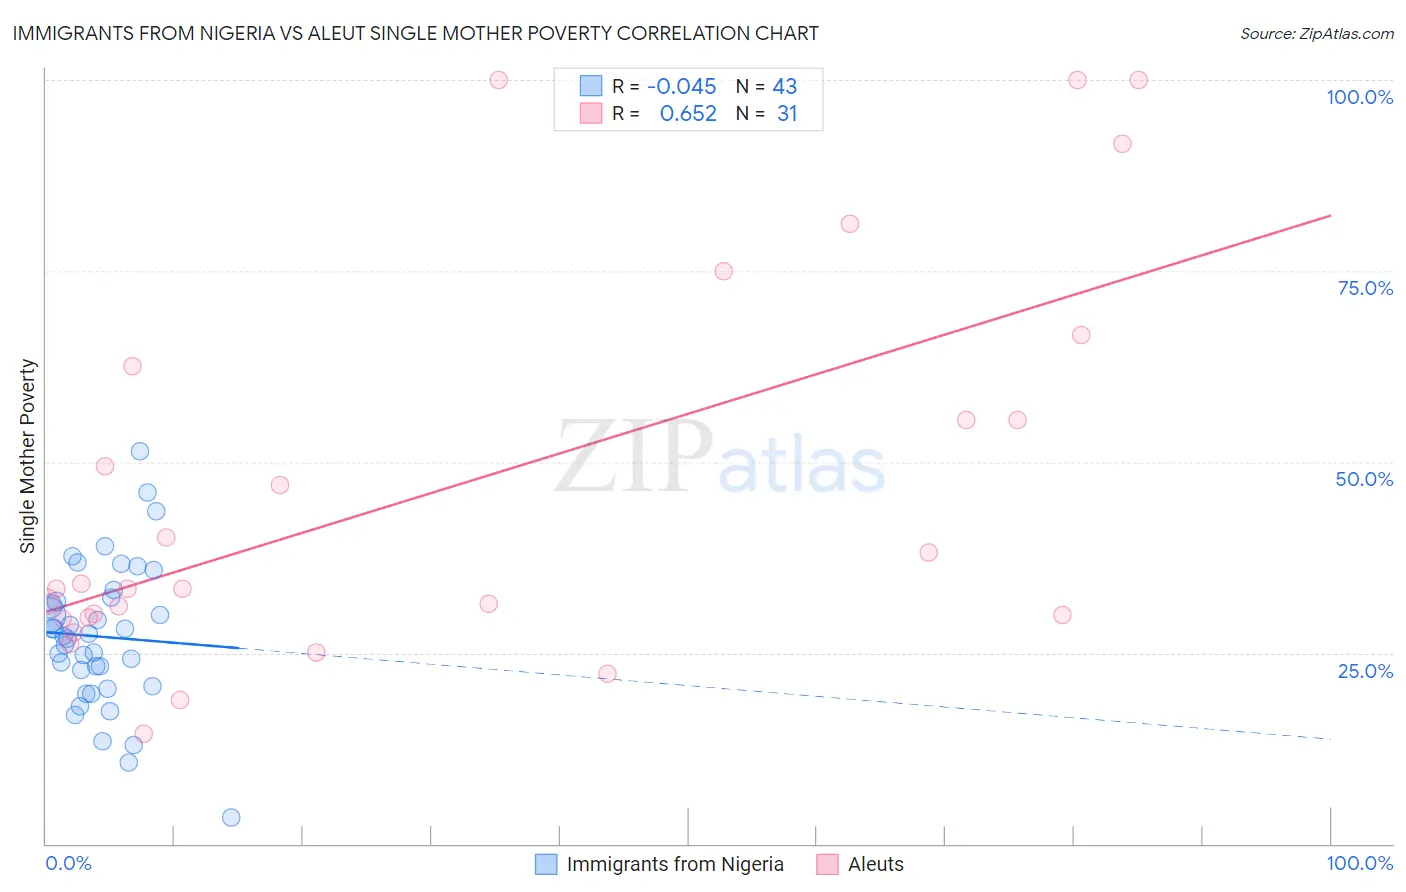
Immigrants from Nigeria vs Aleut Single Mother Poverty Correlation Chart
The statistical analysis conducted on geographies consisting of 280,043,423 people shows no correlation between the proportion of Immigrants from Nigeria and poverty level among single mothers in the United States with a correlation coefficient (R) of -0.045 and weighted average of 28.9%. Similarly, the statistical analysis conducted on geographies consisting of 61,416,159 people shows a significant positive correlation between the proportion of Aleuts and poverty level among single mothers in the United States with a correlation coefficient (R) of 0.652 and weighted average of 32.9%, a difference of 13.8%.
Single Mother Poverty Correlation Summary
| Measurement | Immigrants from Nigeria | Aleut |
| Minimum | 3.4% | 14.4% |
| Maximum | 51.4% | 100.0% |
| Range | 47.9% | 85.6% |
| Mean | 27.1% | 46.6% |
| Median | 27.2% | 33.4% |
| Interquartile 25% (IQ1) | 20.7% | 29.6% |
| Interquartile 75% (IQ3) | 32.3% | 62.5% |
| Interquartile Range (IQR) | 11.7% | 32.9% |
| Standard Deviation (Sample) | 9.4% | 25.6% |
| Standard Deviation (Population) | 9.3% | 25.2% |
Similar Demographics by Single Mother Poverty
Demographics Similar to Immigrants from Nigeria by Single Mother Poverty
In terms of single mother poverty, the demographic groups most similar to Immigrants from Nigeria are Immigrants from Kenya (28.9%, a difference of 0.0%), Scandinavian (28.9%, a difference of 0.020%), Immigrants from Cambodia (28.9%, a difference of 0.040%), Japanese (28.9%, a difference of 0.11%), and Czech (28.9%, a difference of 0.14%).
| Demographics | Rating | Rank | Single Mother Poverty |
| Iraqis | 71.5 /100 | #156 | Good 28.8% |
| Immigrants | Western Europe | 71.1 /100 | #157 | Good 28.9% |
| Immigrants | Hungary | 70.6 /100 | #158 | Good 28.9% |
| Czechs | 68.4 /100 | #159 | Good 28.9% |
| Japanese | 68.0 /100 | #160 | Good 28.9% |
| Immigrants | Cambodia | 66.6 /100 | #161 | Good 28.9% |
| Scandinavians | 66.2 /100 | #162 | Good 28.9% |
| Immigrants | Nigeria | 65.9 /100 | #163 | Good 28.9% |
| Immigrants | Kenya | 65.9 /100 | #164 | Good 28.9% |
| Arabs | 60.7 /100 | #165 | Good 29.0% |
| Inupiat | 60.4 /100 | #166 | Good 29.0% |
| Costa Ricans | 58.4 /100 | #167 | Average 29.0% |
| Europeans | 57.6 /100 | #168 | Average 29.1% |
| Immigrants | Uruguay | 57.2 /100 | #169 | Average 29.1% |
| New Zealanders | 55.1 /100 | #170 | Average 29.1% |
Demographics Similar to Aleuts by Single Mother Poverty
In terms of single mother poverty, the demographic groups most similar to Aleuts are Shoshone (32.9%, a difference of 0.030%), Guatemalan (32.9%, a difference of 0.050%), French American Indian (33.1%, a difference of 0.63%), Yaqui (33.1%, a difference of 0.66%), and Blackfeet (33.2%, a difference of 0.82%).
| Demographics | Rating | Rank | Single Mother Poverty |
| Yup'ik | 0.0 /100 | #286 | Tragic 32.5% |
| Immigrants | Dominica | 0.0 /100 | #287 | Tragic 32.5% |
| Somalis | 0.0 /100 | #288 | Tragic 32.6% |
| U.S. Virgin Islanders | 0.0 /100 | #289 | Tragic 32.6% |
| Osage | 0.0 /100 | #290 | Tragic 32.6% |
| Guatemalans | 0.0 /100 | #291 | Tragic 32.9% |
| Shoshone | 0.0 /100 | #292 | Tragic 32.9% |
| Aleuts | 0.0 /100 | #293 | Tragic 32.9% |
| French American Indians | 0.0 /100 | #294 | Tragic 33.1% |
| Yaqui | 0.0 /100 | #295 | Tragic 33.1% |
| Blackfeet | 0.0 /100 | #296 | Tragic 33.2% |
| Pennsylvania Germans | 0.0 /100 | #297 | Tragic 33.2% |
| Africans | 0.0 /100 | #298 | Tragic 33.3% |
| Immigrants | Guatemala | 0.0 /100 | #299 | Tragic 33.3% |
| Hispanics or Latinos | 0.0 /100 | #300 | Tragic 33.3% |