Immigrants from Barbados vs Aleut Single Mother Poverty
COMPARE
Immigrants from Barbados
Aleut
Single Mother Poverty
Single Mother Poverty Comparison
Immigrants from Barbados
Aleuts
30.2%
SINGLE MOTHER POVERTY
5.0/ 100
METRIC RATING
229th/ 347
METRIC RANK
32.9%
SINGLE MOTHER POVERTY
0.0/ 100
METRIC RATING
293rd/ 347
METRIC RANK
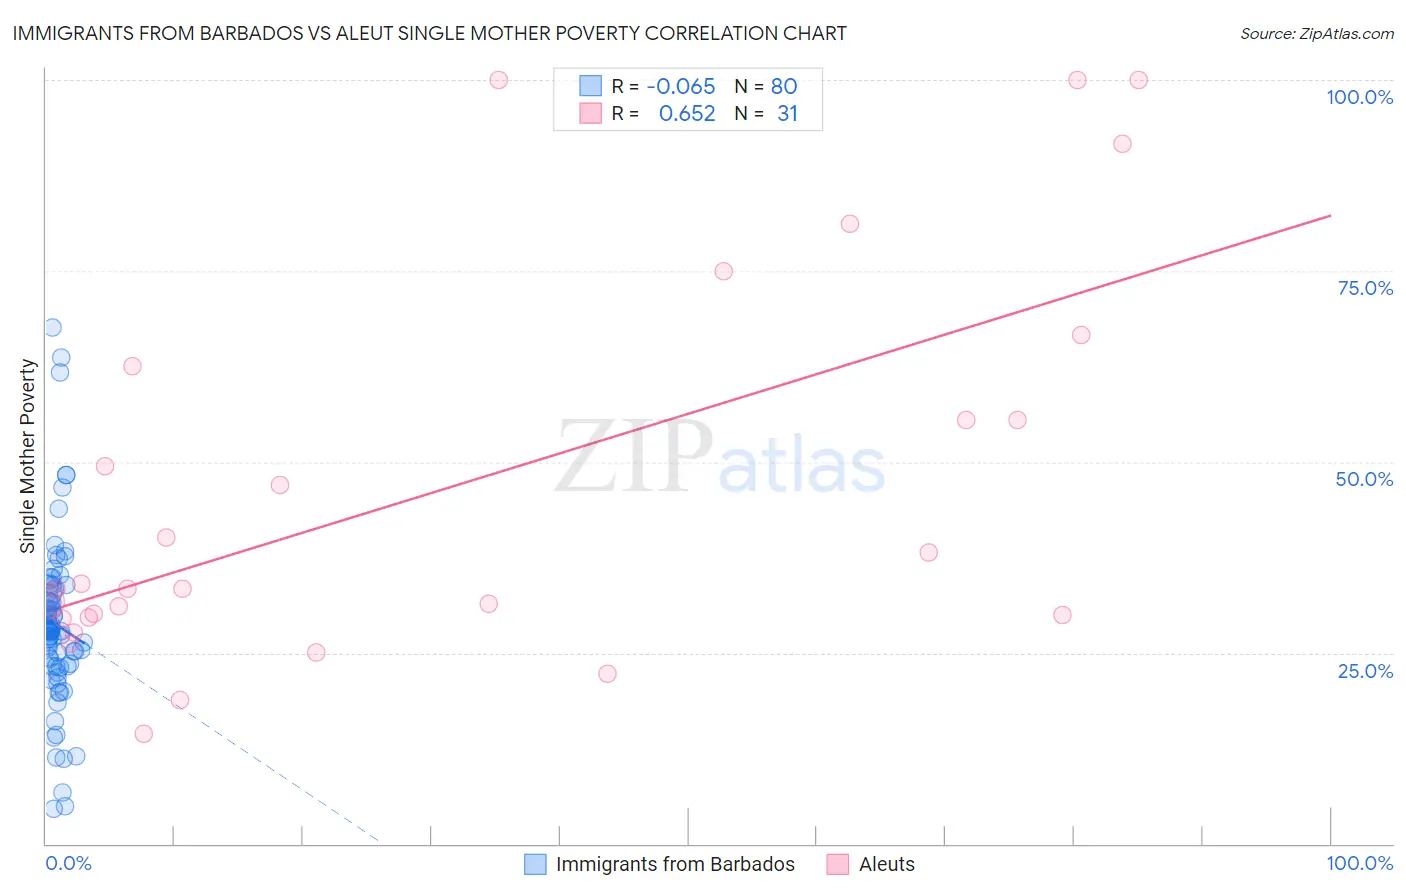
Immigrants from Barbados vs Aleut Single Mother Poverty Correlation Chart
The statistical analysis conducted on geographies consisting of 111,955,379 people shows a slight negative correlation between the proportion of Immigrants from Barbados and poverty level among single mothers in the United States with a correlation coefficient (R) of -0.065 and weighted average of 30.2%. Similarly, the statistical analysis conducted on geographies consisting of 61,416,159 people shows a significant positive correlation between the proportion of Aleuts and poverty level among single mothers in the United States with a correlation coefficient (R) of 0.652 and weighted average of 32.9%, a difference of 9.0%.
Single Mother Poverty Correlation Summary
| Measurement | Immigrants from Barbados | Aleut |
| Minimum | 4.6% | 14.4% |
| Maximum | 67.7% | 100.0% |
| Range | 63.0% | 85.6% |
| Mean | 28.7% | 46.6% |
| Median | 27.9% | 33.4% |
| Interquartile 25% (IQ1) | 23.2% | 29.6% |
| Interquartile 75% (IQ3) | 33.2% | 62.5% |
| Interquartile Range (IQR) | 10.0% | 32.9% |
| Standard Deviation (Sample) | 11.2% | 25.6% |
| Standard Deviation (Population) | 11.1% | 25.2% |
Similar Demographics by Single Mother Poverty
Demographics Similar to Immigrants from Barbados by Single Mother Poverty
In terms of single mother poverty, the demographic groups most similar to Immigrants from Barbados are English (30.2%, a difference of 0.040%), Spaniard (30.2%, a difference of 0.090%), Dutch (30.2%, a difference of 0.19%), Immigrants from Liberia (30.1%, a difference of 0.20%), and Scottish (30.1%, a difference of 0.23%).
| Demographics | Rating | Rank | Single Mother Poverty |
| Sudanese | 7.6 /100 | #222 | Tragic 30.0% |
| Immigrants | Cuba | 6.9 /100 | #223 | Tragic 30.1% |
| Immigrants | Sudan | 6.5 /100 | #224 | Tragic 30.1% |
| Spanish | 6.3 /100 | #225 | Tragic 30.1% |
| Scottish | 6.0 /100 | #226 | Tragic 30.1% |
| Immigrants | Liberia | 5.9 /100 | #227 | Tragic 30.1% |
| Spaniards | 5.4 /100 | #228 | Tragic 30.2% |
| Immigrants | Barbados | 5.0 /100 | #229 | Tragic 30.2% |
| English | 4.8 /100 | #230 | Tragic 30.2% |
| Dutch | 4.3 /100 | #231 | Tragic 30.2% |
| Alaskan Athabascans | 4.1 /100 | #232 | Tragic 30.3% |
| Immigrants | Middle Africa | 3.5 /100 | #233 | Tragic 30.3% |
| Immigrants | Nicaragua | 3.5 /100 | #234 | Tragic 30.3% |
| Immigrants | Grenada | 3.4 /100 | #235 | Tragic 30.3% |
| Welsh | 3.2 /100 | #236 | Tragic 30.4% |
Demographics Similar to Aleuts by Single Mother Poverty
In terms of single mother poverty, the demographic groups most similar to Aleuts are Shoshone (32.9%, a difference of 0.030%), Guatemalan (32.9%, a difference of 0.050%), French American Indian (33.1%, a difference of 0.63%), Yaqui (33.1%, a difference of 0.66%), and Blackfeet (33.2%, a difference of 0.82%).
| Demographics | Rating | Rank | Single Mother Poverty |
| Yup'ik | 0.0 /100 | #286 | Tragic 32.5% |
| Immigrants | Dominica | 0.0 /100 | #287 | Tragic 32.5% |
| Somalis | 0.0 /100 | #288 | Tragic 32.6% |
| U.S. Virgin Islanders | 0.0 /100 | #289 | Tragic 32.6% |
| Osage | 0.0 /100 | #290 | Tragic 32.6% |
| Guatemalans | 0.0 /100 | #291 | Tragic 32.9% |
| Shoshone | 0.0 /100 | #292 | Tragic 32.9% |
| Aleuts | 0.0 /100 | #293 | Tragic 32.9% |
| French American Indians | 0.0 /100 | #294 | Tragic 33.1% |
| Yaqui | 0.0 /100 | #295 | Tragic 33.1% |
| Blackfeet | 0.0 /100 | #296 | Tragic 33.2% |
| Pennsylvania Germans | 0.0 /100 | #297 | Tragic 33.2% |
| Africans | 0.0 /100 | #298 | Tragic 33.3% |
| Immigrants | Guatemala | 0.0 /100 | #299 | Tragic 33.3% |
| Hispanics or Latinos | 0.0 /100 | #300 | Tragic 33.3% |