Belgian vs German Female Poverty
COMPARE
Belgian
German
Female Poverty
Female Poverty Comparison
Belgians
Germans
12.4%
FEMALE POVERTY
95.8/ 100
METRIC RATING
91st/ 347
METRIC RANK
12.2%
FEMALE POVERTY
98.0/ 100
METRIC RATING
64th/ 347
METRIC RANK
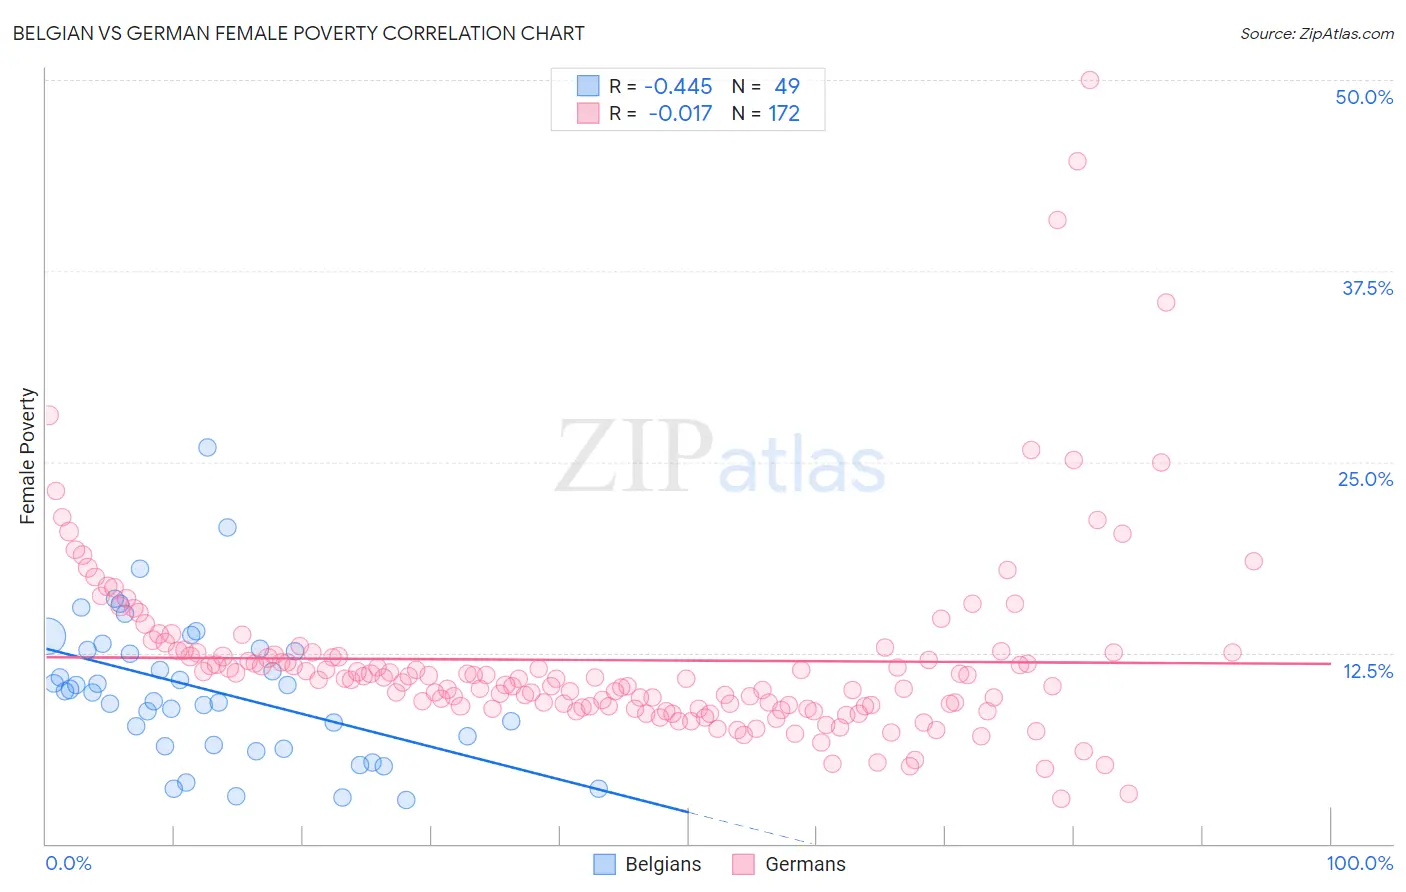
Belgian vs German Female Poverty Correlation Chart
The statistical analysis conducted on geographies consisting of 355,775,724 people shows a moderate negative correlation between the proportion of Belgians and poverty level among females in the United States with a correlation coefficient (R) of -0.445 and weighted average of 12.4%. Similarly, the statistical analysis conducted on geographies consisting of 579,385,856 people shows no correlation between the proportion of Germans and poverty level among females in the United States with a correlation coefficient (R) of -0.017 and weighted average of 12.2%, a difference of 2.0%.
Female Poverty Correlation Summary
| Measurement | Belgian | German |
| Minimum | 2.9% | 2.9% |
| Maximum | 25.9% | 50.0% |
| Range | 23.0% | 47.1% |
| Mean | 10.1% | 12.0% |
| Median | 10.0% | 10.8% |
| Interquartile 25% (IQ1) | 6.4% | 9.0% |
| Interquartile 75% (IQ3) | 12.8% | 12.5% |
| Interquartile Range (IQR) | 6.3% | 3.5% |
| Standard Deviation (Sample) | 4.7% | 6.3% |
| Standard Deviation (Population) | 4.6% | 6.3% |
Similar Demographics by Female Poverty
Demographics Similar to Belgians by Female Poverty
In terms of female poverty, the demographic groups most similar to Belgians are Immigrants from Denmark (12.4%, a difference of 0.010%), Czechoslovakian (12.4%, a difference of 0.010%), Immigrants from Egypt (12.5%, a difference of 0.18%), Immigrants from Indonesia (12.5%, a difference of 0.21%), and English (12.4%, a difference of 0.23%).
| Demographics | Rating | Rank | Female Poverty |
| Northern Europeans | 96.6 /100 | #84 | Exceptional 12.4% |
| Irish | 96.5 /100 | #85 | Exceptional 12.4% |
| Dutch | 96.5 /100 | #86 | Exceptional 12.4% |
| Okinawans | 96.4 /100 | #87 | Exceptional 12.4% |
| Finns | 96.4 /100 | #88 | Exceptional 12.4% |
| English | 96.1 /100 | #89 | Exceptional 12.4% |
| Immigrants | Denmark | 95.8 /100 | #90 | Exceptional 12.4% |
| Belgians | 95.8 /100 | #91 | Exceptional 12.4% |
| Czechoslovakians | 95.7 /100 | #92 | Exceptional 12.4% |
| Immigrants | Egypt | 95.5 /100 | #93 | Exceptional 12.5% |
| Immigrants | Indonesia | 95.4 /100 | #94 | Exceptional 12.5% |
| Immigrants | South Africa | 95.4 /100 | #95 | Exceptional 12.5% |
| British | 95.2 /100 | #96 | Exceptional 12.5% |
| Australians | 95.2 /100 | #97 | Exceptional 12.5% |
| Native Hawaiians | 95.1 /100 | #98 | Exceptional 12.5% |
Demographics Similar to Germans by Female Poverty
In terms of female poverty, the demographic groups most similar to Germans are Ukrainian (12.2%, a difference of 0.030%), Indian (Asian) (12.2%, a difference of 0.030%), Austrian (12.2%, a difference of 0.040%), Immigrants from Italy (12.2%, a difference of 0.11%), and Immigrants from Asia (12.2%, a difference of 0.13%).
| Demographics | Rating | Rank | Female Poverty |
| Immigrants | Serbia | 98.3 /100 | #57 | Exceptional 12.1% |
| Scandinavians | 98.2 /100 | #58 | Exceptional 12.1% |
| Immigrants | Europe | 98.2 /100 | #59 | Exceptional 12.1% |
| Immigrants | Australia | 98.1 /100 | #60 | Exceptional 12.2% |
| Immigrants | Asia | 98.1 /100 | #61 | Exceptional 12.2% |
| Immigrants | Italy | 98.0 /100 | #62 | Exceptional 12.2% |
| Ukrainians | 98.0 /100 | #63 | Exceptional 12.2% |
| Germans | 98.0 /100 | #64 | Exceptional 12.2% |
| Indians (Asian) | 97.9 /100 | #65 | Exceptional 12.2% |
| Austrians | 97.9 /100 | #66 | Exceptional 12.2% |
| Immigrants | Eastern Asia | 97.8 /100 | #67 | Exceptional 12.2% |
| Immigrants | Netherlands | 97.8 /100 | #68 | Exceptional 12.2% |
| Swiss | 97.7 /100 | #69 | Exceptional 12.2% |
| Immigrants | Belgium | 97.7 /100 | #70 | Exceptional 12.2% |
| Carpatho Rusyns | 97.6 /100 | #71 | Exceptional 12.2% |