Ottawa vs German Female Poverty
COMPARE
Ottawa
German
Female Poverty
Female Poverty Comparison
Ottawa
Germans
15.5%
FEMALE POVERTY
0.2/ 100
METRIC RATING
255th/ 347
METRIC RANK
12.2%
FEMALE POVERTY
98.0/ 100
METRIC RATING
64th/ 347
METRIC RANK
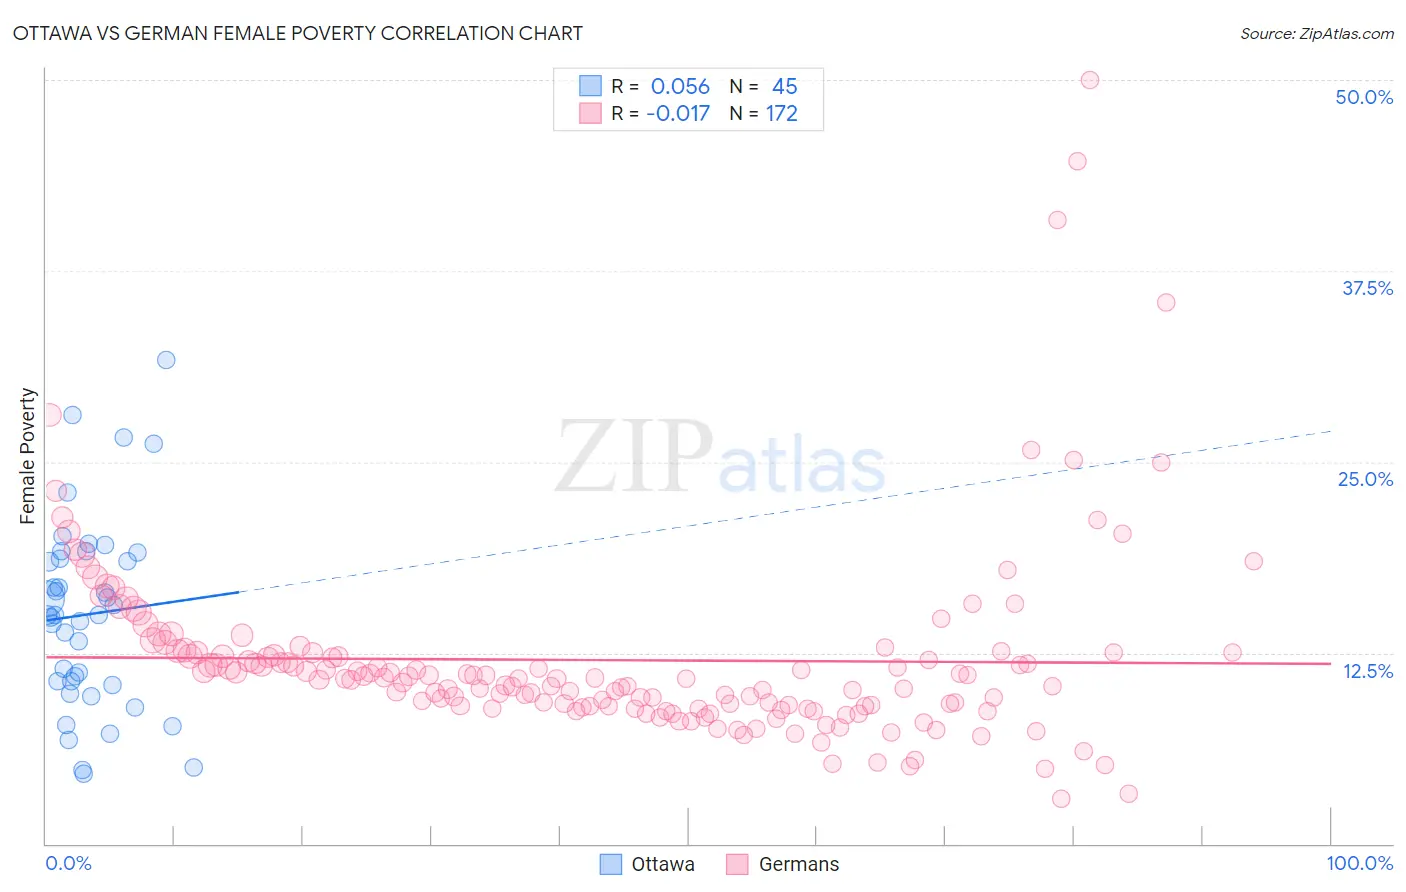
Ottawa vs German Female Poverty Correlation Chart
The statistical analysis conducted on geographies consisting of 49,943,678 people shows a slight positive correlation between the proportion of Ottawa and poverty level among females in the United States with a correlation coefficient (R) of 0.056 and weighted average of 15.5%. Similarly, the statistical analysis conducted on geographies consisting of 579,385,856 people shows no correlation between the proportion of Germans and poverty level among females in the United States with a correlation coefficient (R) of -0.017 and weighted average of 12.2%, a difference of 27.1%.
Female Poverty Correlation Summary
| Measurement | Ottawa | German |
| Minimum | 4.6% | 2.9% |
| Maximum | 31.7% | 50.0% |
| Range | 27.1% | 47.1% |
| Mean | 15.0% | 12.0% |
| Median | 15.0% | 10.8% |
| Interquartile 25% (IQ1) | 10.5% | 9.0% |
| Interquartile 75% (IQ3) | 18.9% | 12.5% |
| Interquartile Range (IQR) | 8.3% | 3.5% |
| Standard Deviation (Sample) | 6.2% | 6.3% |
| Standard Deviation (Population) | 6.1% | 6.3% |
Similar Demographics by Female Poverty
Demographics Similar to Ottawa by Female Poverty
In terms of female poverty, the demographic groups most similar to Ottawa are Jamaican (15.5%, a difference of 0.30%), Trinidadian and Tobagonian (15.4%, a difference of 0.31%), Immigrants from Jamaica (15.6%, a difference of 0.43%), Shoshone (15.6%, a difference of 0.49%), and Liberian (15.4%, a difference of 0.54%).
| Demographics | Rating | Rank | Female Poverty |
| Immigrants | Ghana | 0.3 /100 | #248 | Tragic 15.3% |
| Salvadorans | 0.3 /100 | #249 | Tragic 15.3% |
| Immigrants | Western Africa | 0.3 /100 | #250 | Tragic 15.3% |
| Immigrants | Trinidad and Tobago | 0.3 /100 | #251 | Tragic 15.4% |
| Immigrants | Burma/Myanmar | 0.3 /100 | #252 | Tragic 15.4% |
| Liberians | 0.2 /100 | #253 | Tragic 15.4% |
| Trinidadians and Tobagonians | 0.2 /100 | #254 | Tragic 15.4% |
| Ottawa | 0.2 /100 | #255 | Tragic 15.5% |
| Jamaicans | 0.2 /100 | #256 | Tragic 15.5% |
| Immigrants | Jamaica | 0.1 /100 | #257 | Tragic 15.6% |
| Shoshone | 0.1 /100 | #258 | Tragic 15.6% |
| Cape Verdeans | 0.1 /100 | #259 | Tragic 15.6% |
| Immigrants | Guyana | 0.1 /100 | #260 | Tragic 15.6% |
| Guyanese | 0.1 /100 | #261 | Tragic 15.6% |
| Mexican American Indians | 0.1 /100 | #262 | Tragic 15.6% |
Demographics Similar to Germans by Female Poverty
In terms of female poverty, the demographic groups most similar to Germans are Ukrainian (12.2%, a difference of 0.030%), Indian (Asian) (12.2%, a difference of 0.030%), Austrian (12.2%, a difference of 0.040%), Immigrants from Italy (12.2%, a difference of 0.11%), and Immigrants from Asia (12.2%, a difference of 0.13%).
| Demographics | Rating | Rank | Female Poverty |
| Immigrants | Serbia | 98.3 /100 | #57 | Exceptional 12.1% |
| Scandinavians | 98.2 /100 | #58 | Exceptional 12.1% |
| Immigrants | Europe | 98.2 /100 | #59 | Exceptional 12.1% |
| Immigrants | Australia | 98.1 /100 | #60 | Exceptional 12.2% |
| Immigrants | Asia | 98.1 /100 | #61 | Exceptional 12.2% |
| Immigrants | Italy | 98.0 /100 | #62 | Exceptional 12.2% |
| Ukrainians | 98.0 /100 | #63 | Exceptional 12.2% |
| Germans | 98.0 /100 | #64 | Exceptional 12.2% |
| Indians (Asian) | 97.9 /100 | #65 | Exceptional 12.2% |
| Austrians | 97.9 /100 | #66 | Exceptional 12.2% |
| Immigrants | Eastern Asia | 97.8 /100 | #67 | Exceptional 12.2% |
| Immigrants | Netherlands | 97.8 /100 | #68 | Exceptional 12.2% |
| Swiss | 97.7 /100 | #69 | Exceptional 12.2% |
| Immigrants | Belgium | 97.7 /100 | #70 | Exceptional 12.2% |
| Carpatho Rusyns | 97.6 /100 | #71 | Exceptional 12.2% |