Belgian vs Immigrants from Ghana Female Poverty
COMPARE
Belgian
Immigrants from Ghana
Female Poverty
Female Poverty Comparison
Belgians
Immigrants from Ghana
12.4%
FEMALE POVERTY
95.8/ 100
METRIC RATING
91st/ 347
METRIC RANK
15.3%
FEMALE POVERTY
0.3/ 100
METRIC RATING
248th/ 347
METRIC RANK
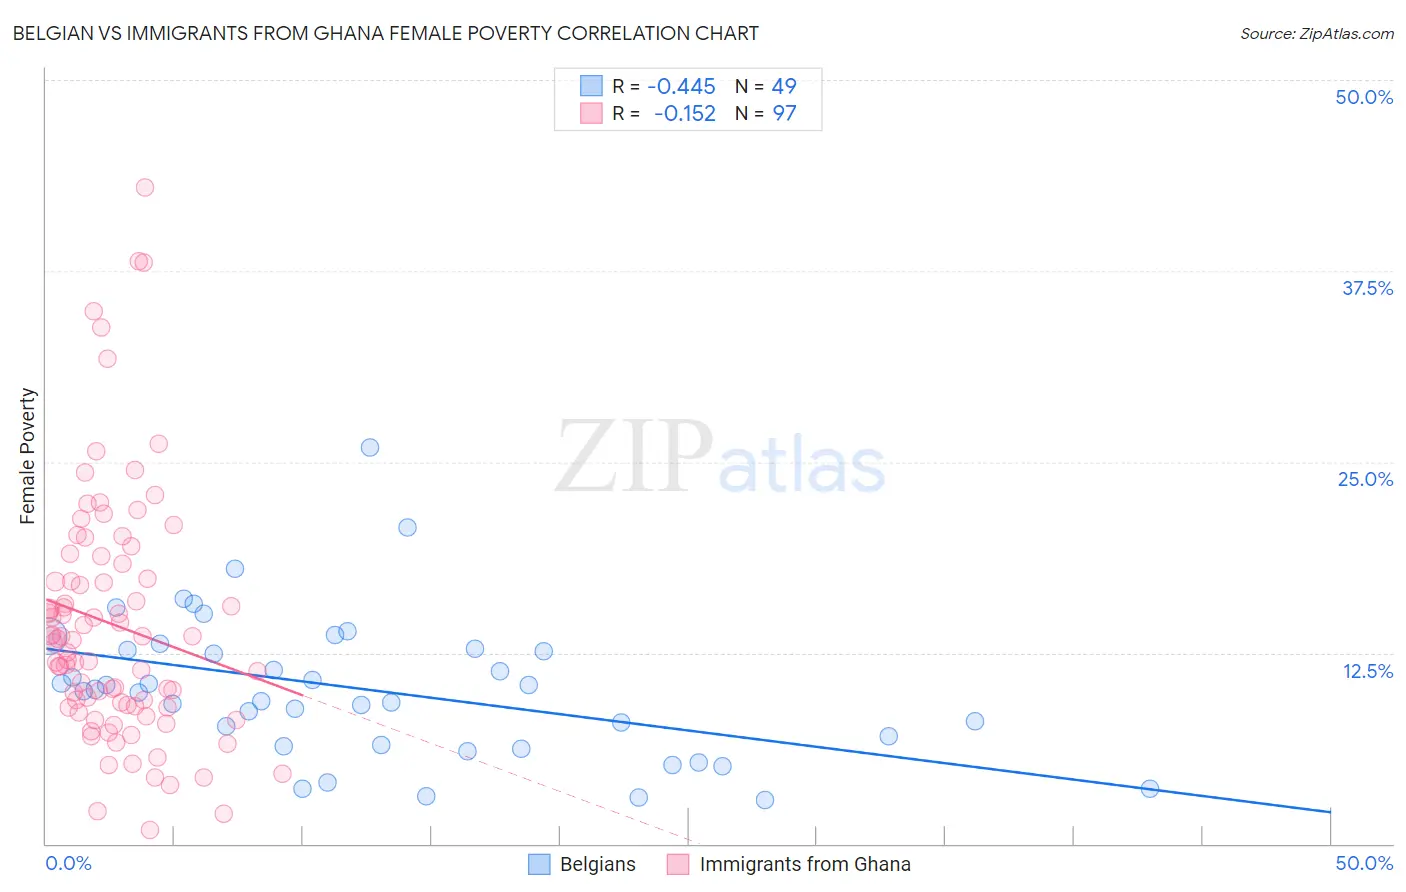
Belgian vs Immigrants from Ghana Female Poverty Correlation Chart
The statistical analysis conducted on geographies consisting of 355,775,724 people shows a moderate negative correlation between the proportion of Belgians and poverty level among females in the United States with a correlation coefficient (R) of -0.445 and weighted average of 12.4%. Similarly, the statistical analysis conducted on geographies consisting of 199,796,197 people shows a poor negative correlation between the proportion of Immigrants from Ghana and poverty level among females in the United States with a correlation coefficient (R) of -0.152 and weighted average of 15.3%, a difference of 23.1%.
Female Poverty Correlation Summary
| Measurement | Belgian | Immigrants from Ghana |
| Minimum | 2.9% | 0.90% |
| Maximum | 25.9% | 43.0% |
| Range | 23.0% | 42.1% |
| Mean | 10.1% | 14.3% |
| Median | 10.0% | 13.3% |
| Interquartile 25% (IQ1) | 6.4% | 9.0% |
| Interquartile 75% (IQ3) | 12.8% | 17.8% |
| Interquartile Range (IQR) | 6.3% | 8.9% |
| Standard Deviation (Sample) | 4.7% | 8.1% |
| Standard Deviation (Population) | 4.6% | 8.0% |
Similar Demographics by Female Poverty
Demographics Similar to Belgians by Female Poverty
In terms of female poverty, the demographic groups most similar to Belgians are Immigrants from Denmark (12.4%, a difference of 0.010%), Czechoslovakian (12.4%, a difference of 0.010%), Immigrants from Egypt (12.5%, a difference of 0.18%), Immigrants from Indonesia (12.5%, a difference of 0.21%), and English (12.4%, a difference of 0.23%).
| Demographics | Rating | Rank | Female Poverty |
| Northern Europeans | 96.6 /100 | #84 | Exceptional 12.4% |
| Irish | 96.5 /100 | #85 | Exceptional 12.4% |
| Dutch | 96.5 /100 | #86 | Exceptional 12.4% |
| Okinawans | 96.4 /100 | #87 | Exceptional 12.4% |
| Finns | 96.4 /100 | #88 | Exceptional 12.4% |
| English | 96.1 /100 | #89 | Exceptional 12.4% |
| Immigrants | Denmark | 95.8 /100 | #90 | Exceptional 12.4% |
| Belgians | 95.8 /100 | #91 | Exceptional 12.4% |
| Czechoslovakians | 95.7 /100 | #92 | Exceptional 12.4% |
| Immigrants | Egypt | 95.5 /100 | #93 | Exceptional 12.5% |
| Immigrants | Indonesia | 95.4 /100 | #94 | Exceptional 12.5% |
| Immigrants | South Africa | 95.4 /100 | #95 | Exceptional 12.5% |
| British | 95.2 /100 | #96 | Exceptional 12.5% |
| Australians | 95.2 /100 | #97 | Exceptional 12.5% |
| Native Hawaiians | 95.1 /100 | #98 | Exceptional 12.5% |
Demographics Similar to Immigrants from Ghana by Female Poverty
In terms of female poverty, the demographic groups most similar to Immigrants from Ghana are Potawatomi (15.3%, a difference of 0.0%), Cuban (15.3%, a difference of 0.010%), Spanish American Indian (15.3%, a difference of 0.060%), Salvadoran (15.3%, a difference of 0.14%), and Ecuadorian (15.3%, a difference of 0.16%).
| Demographics | Rating | Rank | Female Poverty |
| Immigrants | Sudan | 0.4 /100 | #241 | Tragic 15.2% |
| Nepalese | 0.4 /100 | #242 | Tragic 15.2% |
| Nicaraguans | 0.3 /100 | #243 | Tragic 15.3% |
| Ecuadorians | 0.3 /100 | #244 | Tragic 15.3% |
| Spanish American Indians | 0.3 /100 | #245 | Tragic 15.3% |
| Cubans | 0.3 /100 | #246 | Tragic 15.3% |
| Potawatomi | 0.3 /100 | #247 | Tragic 15.3% |
| Immigrants | Ghana | 0.3 /100 | #248 | Tragic 15.3% |
| Salvadorans | 0.3 /100 | #249 | Tragic 15.3% |
| Immigrants | Western Africa | 0.3 /100 | #250 | Tragic 15.3% |
| Immigrants | Trinidad and Tobago | 0.3 /100 | #251 | Tragic 15.4% |
| Immigrants | Burma/Myanmar | 0.3 /100 | #252 | Tragic 15.4% |
| Liberians | 0.2 /100 | #253 | Tragic 15.4% |
| Trinidadians and Tobagonians | 0.2 /100 | #254 | Tragic 15.4% |
| Ottawa | 0.2 /100 | #255 | Tragic 15.5% |