Belgian vs Danish Female Poverty Among 18-24 Year Olds
COMPARE
Belgian
Danish
Female Poverty Among 18-24 Year Olds
Female Poverty Among 18-24 Year Olds Comparison
Belgians
Danes
19.9%
FEMALE POVERTY AMONG 18-24 YEAR OLDS
69.1/ 100
METRIC RATING
166th/ 347
METRIC RANK
19.8%
FEMALE POVERTY AMONG 18-24 YEAR OLDS
75.5/ 100
METRIC RATING
157th/ 347
METRIC RANK
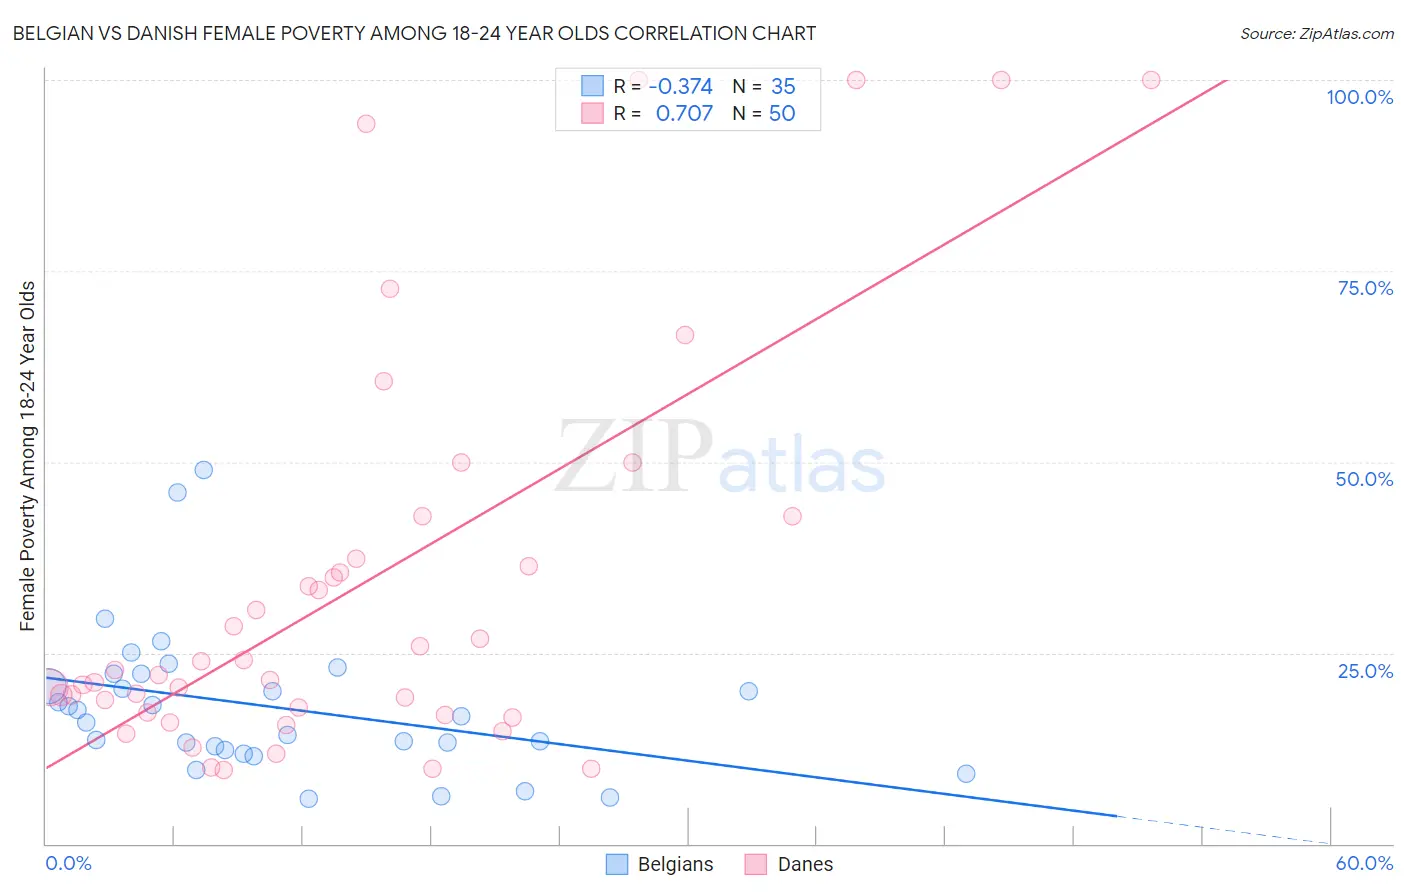
Belgian vs Danish Female Poverty Among 18-24 Year Olds Correlation Chart
The statistical analysis conducted on geographies consisting of 345,924,270 people shows a mild negative correlation between the proportion of Belgians and poverty level among females between the ages 18 and 24 in the United States with a correlation coefficient (R) of -0.374 and weighted average of 19.9%. Similarly, the statistical analysis conducted on geographies consisting of 454,175,861 people shows a strong positive correlation between the proportion of Danes and poverty level among females between the ages 18 and 24 in the United States with a correlation coefficient (R) of 0.707 and weighted average of 19.8%, a difference of 0.40%.
Female Poverty Among 18-24 Year Olds Correlation Summary
| Measurement | Belgian | Danish |
| Minimum | 5.9% | 9.6% |
| Maximum | 49.0% | 100.0% |
| Range | 43.1% | 90.4% |
| Mean | 17.9% | 33.8% |
| Median | 16.7% | 22.4% |
| Interquartile 25% (IQ1) | 12.2% | 17.2% |
| Interquartile 75% (IQ3) | 22.2% | 37.4% |
| Interquartile Range (IQR) | 10.0% | 20.2% |
| Standard Deviation (Sample) | 9.5% | 26.1% |
| Standard Deviation (Population) | 9.4% | 25.9% |
Demographics Similar to Belgians and Danes by Female Poverty Among 18-24 Year Olds
In terms of female poverty among 18-24 year olds, the demographic groups most similar to Belgians are Eastern European (19.9%, a difference of 0.010%), Central American (19.9%, a difference of 0.050%), Malaysian (19.9%, a difference of 0.21%), French Canadian (19.9%, a difference of 0.24%), and Immigrants from Belize (19.8%, a difference of 0.30%). Similarly, the demographic groups most similar to Danes are Immigrants from Lebanon (19.8%, a difference of 0.020%), Immigrants from Belgium (19.8%, a difference of 0.060%), Hungarian (19.8%, a difference of 0.070%), Trinidadian and Tobagonian (19.8%, a difference of 0.070%), and Immigrants from Zimbabwe (19.8%, a difference of 0.080%).
| Demographics | Rating | Rank | Female Poverty Among 18-24 Year Olds |
| Immigrants | Eastern Asia | 79.7 /100 | #151 | Good 19.8% |
| Yugoslavians | 79.0 /100 | #152 | Good 19.8% |
| Immigrants | Japan | 78.1 /100 | #153 | Good 19.8% |
| Immigrants | Zimbabwe | 76.7 /100 | #154 | Good 19.8% |
| Hungarians | 76.6 /100 | #155 | Good 19.8% |
| Immigrants | Belgium | 76.4 /100 | #156 | Good 19.8% |
| Danes | 75.5 /100 | #157 | Good 19.8% |
| Immigrants | Lebanon | 75.3 /100 | #158 | Good 19.8% |
| Trinidadians and Tobagonians | 74.4 /100 | #159 | Good 19.8% |
| Pakistanis | 74.1 /100 | #160 | Good 19.8% |
| Immigrants | Belize | 74.1 /100 | #161 | Good 19.8% |
| French Canadians | 73.0 /100 | #162 | Good 19.9% |
| Malaysians | 72.7 /100 | #163 | Good 19.9% |
| Central Americans | 70.0 /100 | #164 | Good 19.9% |
| Eastern Europeans | 69.3 /100 | #165 | Good 19.9% |
| Belgians | 69.1 /100 | #166 | Good 19.9% |
| Czechoslovakians | 61.8 /100 | #167 | Good 20.0% |
| Fijians | 59.1 /100 | #168 | Average 20.0% |
| Hmong | 55.4 /100 | #169 | Average 20.0% |
| Iranians | 54.7 /100 | #170 | Average 20.1% |
| Immigrants | Nigeria | 54.3 /100 | #171 | Average 20.1% |