Austrian vs Danish Female Poverty Among 18-24 Year Olds
COMPARE
Austrian
Danish
Female Poverty Among 18-24 Year Olds
Female Poverty Among 18-24 Year Olds Comparison
Austrians
Danes
19.5%
FEMALE POVERTY AMONG 18-24 YEAR OLDS
90.7/ 100
METRIC RATING
137th/ 347
METRIC RANK
19.8%
FEMALE POVERTY AMONG 18-24 YEAR OLDS
75.5/ 100
METRIC RATING
157th/ 347
METRIC RANK
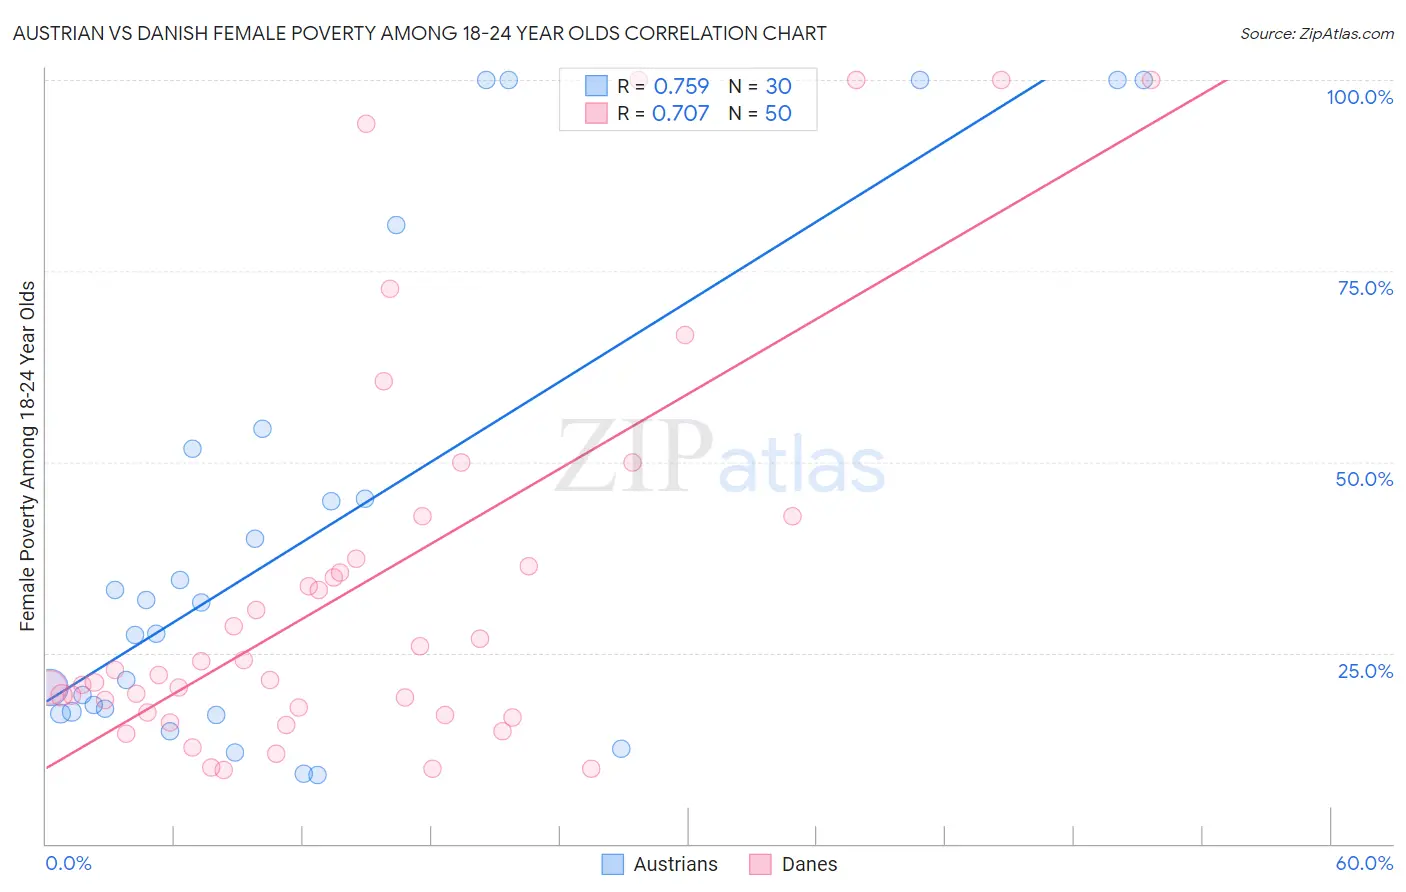
Austrian vs Danish Female Poverty Among 18-24 Year Olds Correlation Chart
The statistical analysis conducted on geographies consisting of 434,794,519 people shows a strong positive correlation between the proportion of Austrians and poverty level among females between the ages 18 and 24 in the United States with a correlation coefficient (R) of 0.759 and weighted average of 19.5%. Similarly, the statistical analysis conducted on geographies consisting of 454,175,861 people shows a strong positive correlation between the proportion of Danes and poverty level among females between the ages 18 and 24 in the United States with a correlation coefficient (R) of 0.707 and weighted average of 19.8%, a difference of 1.5%.
Female Poverty Among 18-24 Year Olds Correlation Summary
| Measurement | Austrian | Danish |
| Minimum | 9.1% | 9.6% |
| Maximum | 100.0% | 100.0% |
| Range | 90.9% | 90.4% |
| Mean | 40.3% | 33.8% |
| Median | 29.5% | 22.4% |
| Interquartile 25% (IQ1) | 17.3% | 17.2% |
| Interquartile 75% (IQ3) | 51.8% | 37.4% |
| Interquartile Range (IQR) | 34.5% | 20.2% |
| Standard Deviation (Sample) | 31.3% | 26.1% |
| Standard Deviation (Population) | 30.8% | 25.9% |
Demographics Similar to Austrians and Danes by Female Poverty Among 18-24 Year Olds
In terms of female poverty among 18-24 year olds, the demographic groups most similar to Austrians are Immigrants from Morocco (19.6%, a difference of 0.12%), Indian (Asian) (19.6%, a difference of 0.32%), Immigrants from Trinidad and Tobago (19.7%, a difference of 0.62%), Pennsylvania German (19.7%, a difference of 0.63%), and Panamanian (19.7%, a difference of 0.72%). Similarly, the demographic groups most similar to Danes are Immigrants from Belgium (19.8%, a difference of 0.060%), Hungarian (19.8%, a difference of 0.070%), Immigrants from Zimbabwe (19.8%, a difference of 0.080%), Immigrants from Japan (19.8%, a difference of 0.18%), and Yugoslavian (19.8%, a difference of 0.25%).
| Demographics | Rating | Rank | Female Poverty Among 18-24 Year Olds |
| Austrians | 90.7 /100 | #137 | Exceptional 19.5% |
| Immigrants | Morocco | 89.9 /100 | #138 | Excellent 19.6% |
| Indians (Asian) | 88.3 /100 | #139 | Excellent 19.6% |
| Immigrants | Trinidad and Tobago | 85.6 /100 | #140 | Excellent 19.7% |
| Pennsylvania Germans | 85.5 /100 | #141 | Excellent 19.7% |
| Panamanians | 84.6 /100 | #142 | Excellent 19.7% |
| Slavs | 84.4 /100 | #143 | Excellent 19.7% |
| Immigrants | Northern Africa | 84.1 /100 | #144 | Excellent 19.7% |
| Canadians | 83.8 /100 | #145 | Excellent 19.7% |
| Immigrants | Bosnia and Herzegovina | 83.6 /100 | #146 | Excellent 19.7% |
| Immigrants | Austria | 83.1 /100 | #147 | Excellent 19.7% |
| Immigrants | Latin America | 81.3 /100 | #148 | Excellent 19.7% |
| Immigrants | Oceania | 81.2 /100 | #149 | Excellent 19.7% |
| Syrians | 80.2 /100 | #150 | Excellent 19.8% |
| Immigrants | Eastern Asia | 79.7 /100 | #151 | Good 19.8% |
| Yugoslavians | 79.0 /100 | #152 | Good 19.8% |
| Immigrants | Japan | 78.1 /100 | #153 | Good 19.8% |
| Immigrants | Zimbabwe | 76.7 /100 | #154 | Good 19.8% |
| Hungarians | 76.6 /100 | #155 | Good 19.8% |
| Immigrants | Belgium | 76.4 /100 | #156 | Good 19.8% |
| Danes | 75.5 /100 | #157 | Good 19.8% |