Basque vs Spanish American Indian Seniors Poverty Over the Age of 75
COMPARE
Basque
Spanish American Indian
Seniors Poverty Over the Age of 75
Seniors Poverty Over the Age of 75 Comparison
Basques
Spanish American Indians
11.5%
SENIORS POVERTY OVER THE AGE OF 75
95.1/ 100
METRIC RATING
81st/ 347
METRIC RANK
15.5%
SENIORS POVERTY OVER THE AGE OF 75
0.0/ 100
METRIC RATING
299th/ 347
METRIC RANK
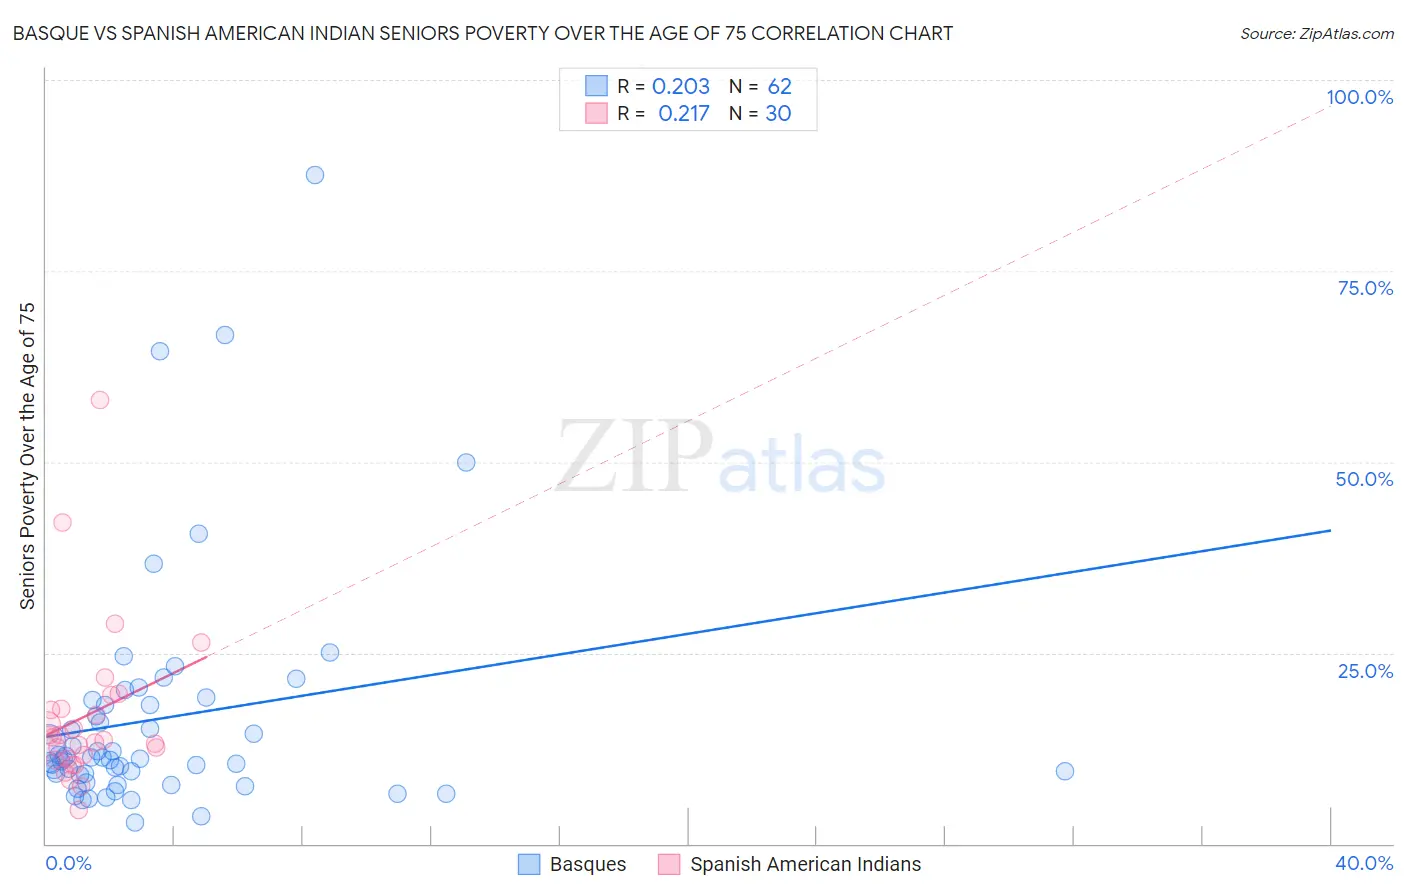
Basque vs Spanish American Indian Seniors Poverty Over the Age of 75 Correlation Chart
The statistical analysis conducted on geographies consisting of 164,990,865 people shows a weak positive correlation between the proportion of Basques and poverty level among seniors over the age of 75 in the United States with a correlation coefficient (R) of 0.203 and weighted average of 11.5%. Similarly, the statistical analysis conducted on geographies consisting of 73,033,240 people shows a weak positive correlation between the proportion of Spanish American Indians and poverty level among seniors over the age of 75 in the United States with a correlation coefficient (R) of 0.217 and weighted average of 15.5%, a difference of 35.4%.
Seniors Poverty Over the Age of 75 Correlation Summary
| Measurement | Basque | Spanish American Indian |
| Minimum | 2.7% | 4.4% |
| Maximum | 87.5% | 58.0% |
| Range | 84.8% | 53.6% |
| Mean | 16.4% | 16.8% |
| Median | 11.1% | 13.8% |
| Interquartile 25% (IQ1) | 9.1% | 11.2% |
| Interquartile 75% (IQ3) | 18.2% | 17.7% |
| Interquartile Range (IQR) | 9.1% | 6.5% |
| Standard Deviation (Sample) | 15.5% | 10.6% |
| Standard Deviation (Population) | 15.4% | 10.4% |
Similar Demographics by Seniors Poverty Over the Age of 75
Demographics Similar to Basques by Seniors Poverty Over the Age of 75
In terms of seniors poverty over the age of 75, the demographic groups most similar to Basques are Iranian (11.5%, a difference of 0.010%), Immigrants from South Africa (11.5%, a difference of 0.10%), Immigrants from Iraq (11.5%, a difference of 0.10%), Alaska Native (11.4%, a difference of 0.12%), and Filipino (11.4%, a difference of 0.17%).
| Demographics | Rating | Rank | Seniors Poverty Over the Age of 75 |
| Delaware | 96.0 /100 | #74 | Exceptional 11.4% |
| Palestinians | 95.8 /100 | #75 | Exceptional 11.4% |
| French Canadians | 95.7 /100 | #76 | Exceptional 11.4% |
| Whites/Caucasians | 95.5 /100 | #77 | Exceptional 11.4% |
| Macedonians | 95.5 /100 | #78 | Exceptional 11.4% |
| Filipinos | 95.5 /100 | #79 | Exceptional 11.4% |
| Alaska Natives | 95.4 /100 | #80 | Exceptional 11.4% |
| Basques | 95.1 /100 | #81 | Exceptional 11.5% |
| Iranians | 95.1 /100 | #82 | Exceptional 11.5% |
| Immigrants | South Africa | 94.9 /100 | #83 | Exceptional 11.5% |
| Immigrants | Iraq | 94.9 /100 | #84 | Exceptional 11.5% |
| Immigrants | Bulgaria | 94.7 /100 | #85 | Exceptional 11.5% |
| Australians | 94.6 /100 | #86 | Exceptional 11.5% |
| Koreans | 94.5 /100 | #87 | Exceptional 11.5% |
| Immigrants | Croatia | 94.5 /100 | #88 | Exceptional 11.5% |
Demographics Similar to Spanish American Indians by Seniors Poverty Over the Age of 75
In terms of seniors poverty over the age of 75, the demographic groups most similar to Spanish American Indians are Bahamian (15.5%, a difference of 0.010%), Native/Alaskan (15.5%, a difference of 0.10%), Honduran (15.4%, a difference of 0.44%), Yuman (15.4%, a difference of 0.72%), and Immigrants from Latin America (15.6%, a difference of 0.79%).
| Demographics | Rating | Rank | Seniors Poverty Over the Age of 75 |
| Colville | 0.0 /100 | #292 | Tragic 15.2% |
| Apache | 0.0 /100 | #293 | Tragic 15.3% |
| Immigrants | Jamaica | 0.0 /100 | #294 | Tragic 15.3% |
| U.S. Virgin Islanders | 0.0 /100 | #295 | Tragic 15.4% |
| Yuman | 0.0 /100 | #296 | Tragic 15.4% |
| Hondurans | 0.0 /100 | #297 | Tragic 15.4% |
| Natives/Alaskans | 0.0 /100 | #298 | Tragic 15.5% |
| Spanish American Indians | 0.0 /100 | #299 | Tragic 15.5% |
| Bahamians | 0.0 /100 | #300 | Tragic 15.5% |
| Immigrants | Latin America | 0.0 /100 | #301 | Tragic 15.6% |
| West Indians | 0.0 /100 | #302 | Tragic 15.7% |
| Immigrants | Honduras | 0.0 /100 | #303 | Tragic 15.7% |
| Immigrants | Trinidad and Tobago | 0.0 /100 | #304 | Tragic 15.7% |
| Ecuadorians | 0.0 /100 | #305 | Tragic 15.7% |
| Hispanics or Latinos | 0.0 /100 | #306 | Tragic 15.8% |