Puerto Rican vs Canadian Seniors Poverty Over the Age of 75
COMPARE
Puerto Rican
Canadian
Seniors Poverty Over the Age of 75
Seniors Poverty Over the Age of 75 Comparison
Puerto Ricans
Canadians
23.2%
SENIORS POVERTY OVER THE AGE OF 75
0.0/ 100
METRIC RATING
346th/ 347
METRIC RANK
11.3%
SENIORS POVERTY OVER THE AGE OF 75
97.7/ 100
METRIC RATING
61st/ 347
METRIC RANK
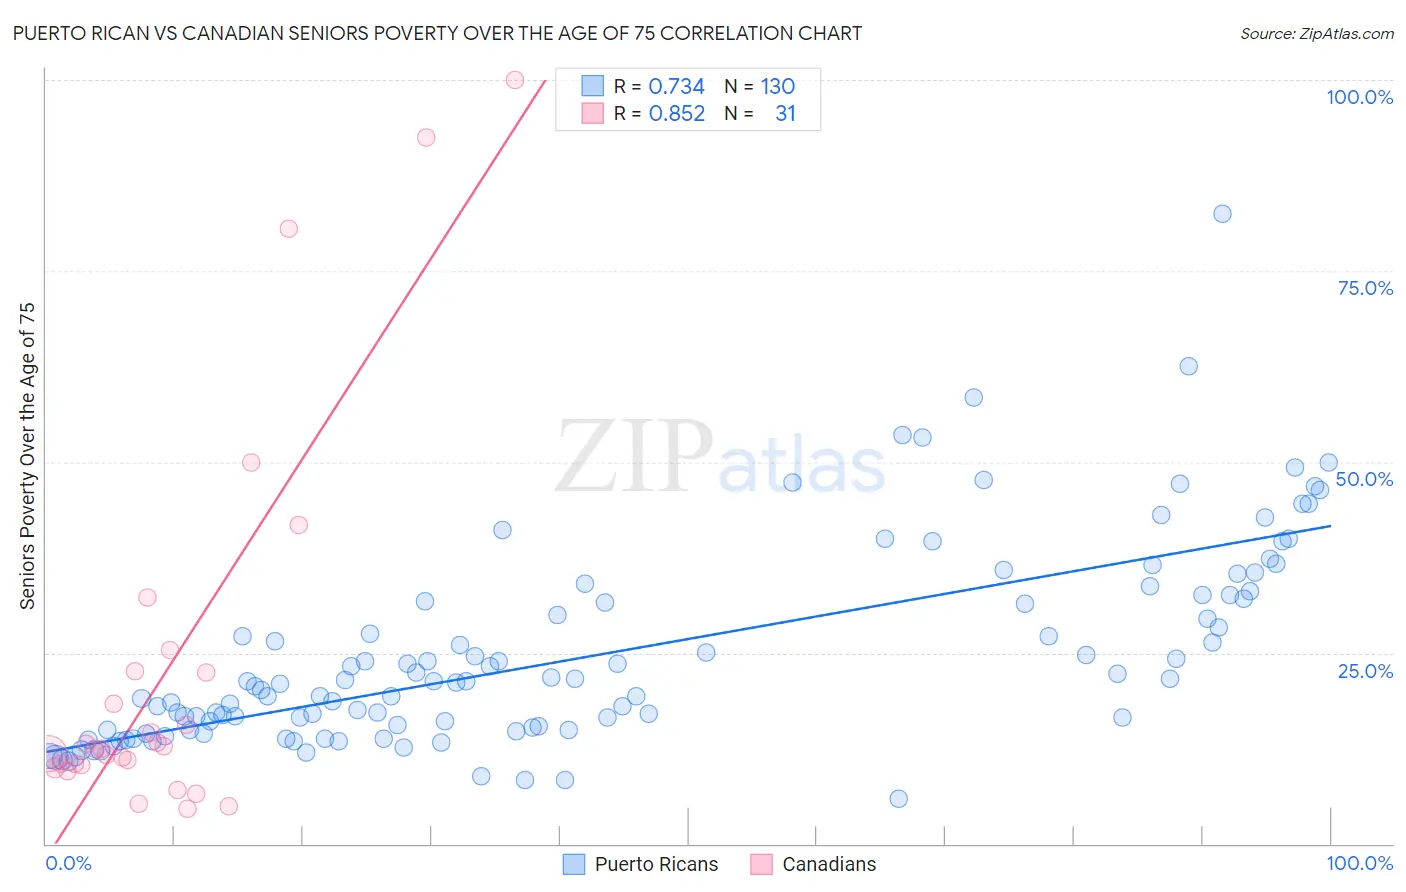
Puerto Rican vs Canadian Seniors Poverty Over the Age of 75 Correlation Chart
The statistical analysis conducted on geographies consisting of 517,384,633 people shows a strong positive correlation between the proportion of Puerto Ricans and poverty level among seniors over the age of 75 in the United States with a correlation coefficient (R) of 0.734 and weighted average of 23.2%. Similarly, the statistical analysis conducted on geographies consisting of 430,823,365 people shows a very strong positive correlation between the proportion of Canadians and poverty level among seniors over the age of 75 in the United States with a correlation coefficient (R) of 0.852 and weighted average of 11.3%, a difference of 106.0%.
Seniors Poverty Over the Age of 75 Correlation Summary
| Measurement | Puerto Rican | Canadian |
| Minimum | 5.9% | 4.7% |
| Maximum | 82.5% | 100.0% |
| Range | 76.6% | 95.3% |
| Mean | 24.7% | 22.7% |
| Median | 21.2% | 12.5% |
| Interquartile 25% (IQ1) | 14.9% | 10.3% |
| Interquartile 75% (IQ3) | 32.0% | 22.6% |
| Interquartile Range (IQR) | 17.1% | 12.3% |
| Standard Deviation (Sample) | 13.1% | 25.0% |
| Standard Deviation (Population) | 13.0% | 24.6% |
Similar Demographics by Seniors Poverty Over the Age of 75
Demographics Similar to Puerto Ricans by Seniors Poverty Over the Age of 75
In terms of seniors poverty over the age of 75, the demographic groups most similar to Puerto Ricans are Pima (23.9%, a difference of 2.9%), Immigrants from Dominican Republic (20.1%, a difference of 15.7%), Immigrants from Cuba (19.9%, a difference of 16.6%), Lumbee (19.7%, a difference of 17.5%), and Dominican (19.6%, a difference of 18.3%).
| Demographics | Rating | Rank | Seniors Poverty Over the Age of 75 |
| Immigrants | Nicaragua | 0.0 /100 | #333 | Tragic 17.6% |
| Immigrants | Grenada | 0.0 /100 | #334 | Tragic 17.8% |
| Cubans | 0.0 /100 | #335 | Tragic 18.0% |
| Immigrants | Caribbean | 0.0 /100 | #336 | Tragic 18.2% |
| Yakama | 0.0 /100 | #337 | Tragic 18.3% |
| Immigrants | Cabo Verde | 0.0 /100 | #338 | Tragic 18.5% |
| Hopi | 0.0 /100 | #339 | Tragic 18.9% |
| Tohono O'odham | 0.0 /100 | #340 | Tragic 19.1% |
| Navajo | 0.0 /100 | #341 | Tragic 19.4% |
| Dominicans | 0.0 /100 | #342 | Tragic 19.6% |
| Lumbee | 0.0 /100 | #343 | Tragic 19.7% |
| Immigrants | Cuba | 0.0 /100 | #344 | Tragic 19.9% |
| Immigrants | Dominican Republic | 0.0 /100 | #345 | Tragic 20.1% |
| Puerto Ricans | 0.0 /100 | #346 | Tragic 23.2% |
| Pima | 0.0 /100 | #347 | Tragic 23.9% |
Demographics Similar to Canadians by Seniors Poverty Over the Age of 75
In terms of seniors poverty over the age of 75, the demographic groups most similar to Canadians are Eastern European (11.3%, a difference of 0.030%), Immigrants from North America (11.3%, a difference of 0.10%), Immigrants from Afghanistan (11.3%, a difference of 0.14%), Immigrants from Netherlands (11.2%, a difference of 0.15%), and Yugoslavian (11.2%, a difference of 0.23%).
| Demographics | Rating | Rank | Seniors Poverty Over the Age of 75 |
| Afghans | 98.2 /100 | #54 | Exceptional 11.2% |
| Hungarians | 98.1 /100 | #55 | Exceptional 11.2% |
| Slavs | 98.1 /100 | #56 | Exceptional 11.2% |
| Immigrants | Canada | 97.9 /100 | #57 | Exceptional 11.2% |
| Yugoslavians | 97.9 /100 | #58 | Exceptional 11.2% |
| Immigrants | Netherlands | 97.8 /100 | #59 | Exceptional 11.2% |
| Eastern Europeans | 97.7 /100 | #60 | Exceptional 11.3% |
| Canadians | 97.7 /100 | #61 | Exceptional 11.3% |
| Immigrants | North America | 97.6 /100 | #62 | Exceptional 11.3% |
| Immigrants | Afghanistan | 97.5 /100 | #63 | Exceptional 11.3% |
| Immigrants | Northern Europe | 97.4 /100 | #64 | Exceptional 11.3% |
| Immigrants | Taiwan | 96.7 /100 | #65 | Exceptional 11.4% |
| Estonians | 96.7 /100 | #66 | Exceptional 11.4% |
| Bolivians | 96.5 /100 | #67 | Exceptional 11.4% |
| Immigrants | Austria | 96.5 /100 | #68 | Exceptional 11.4% |