Nepalese vs Immigrants from Austria Family Poverty
COMPARE
Nepalese
Immigrants from Austria
Family Poverty
Family Poverty Comparison
Nepalese
Immigrants from Austria
10.4%
FAMILY POVERTY
0.8/ 100
METRIC RATING
243rd/ 347
METRIC RANK
7.6%
FAMILY POVERTY
99.1/ 100
METRIC RATING
43rd/ 347
METRIC RANK
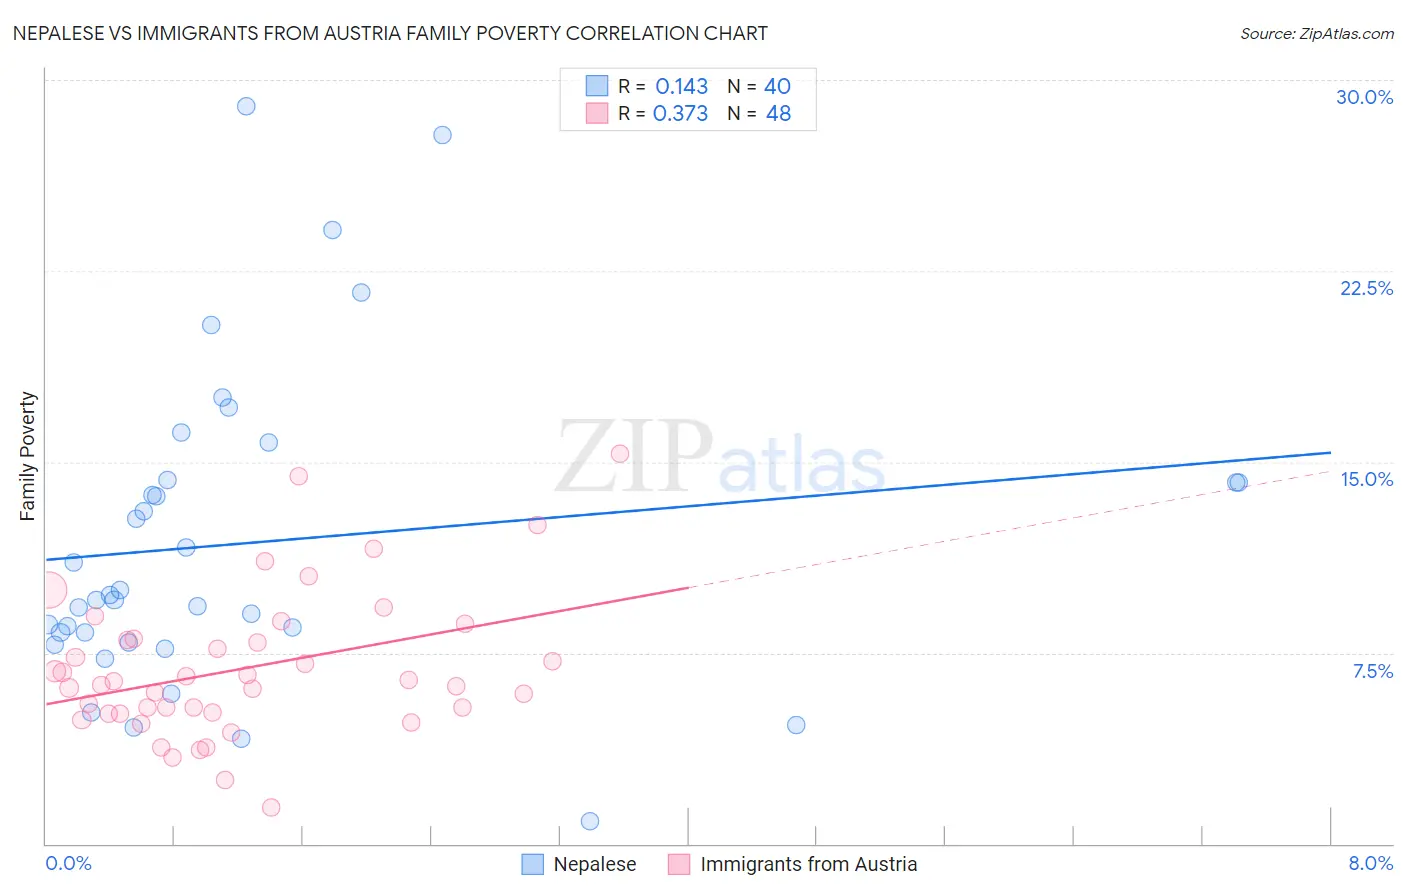
Nepalese vs Immigrants from Austria Family Poverty Correlation Chart
The statistical analysis conducted on geographies consisting of 24,521,755 people shows a poor positive correlation between the proportion of Nepalese and poverty level among families in the United States with a correlation coefficient (R) of 0.143 and weighted average of 10.4%. Similarly, the statistical analysis conducted on geographies consisting of 167,754,432 people shows a mild positive correlation between the proportion of Immigrants from Austria and poverty level among families in the United States with a correlation coefficient (R) of 0.373 and weighted average of 7.6%, a difference of 36.4%.
Family Poverty Correlation Summary
| Measurement | Nepalese | Immigrants from Austria |
| Minimum | 0.90% | 1.4% |
| Maximum | 28.9% | 15.3% |
| Range | 28.0% | 13.9% |
| Mean | 11.8% | 6.9% |
| Median | 9.7% | 6.3% |
| Interquartile 25% (IQ1) | 8.1% | 5.1% |
| Interquartile 75% (IQ3) | 14.2% | 8.0% |
| Interquartile Range (IQR) | 6.1% | 2.9% |
| Standard Deviation (Sample) | 6.2% | 2.8% |
| Standard Deviation (Population) | 6.2% | 2.8% |
Similar Demographics by Family Poverty
Demographics Similar to Nepalese by Family Poverty
In terms of family poverty, the demographic groups most similar to Nepalese are Cree (10.5%, a difference of 0.46%), Alaska Native (10.4%, a difference of 0.48%), Immigrants from Burma/Myanmar (10.5%, a difference of 1.1%), Ghanaian (10.3%, a difference of 1.3%), and Immigrants from the Azores (10.3%, a difference of 1.4%).
| Demographics | Rating | Rank | Family Poverty |
| Immigrants | Nigeria | 1.9 /100 | #236 | Tragic 10.2% |
| Immigrants | Laos | 1.7 /100 | #237 | Tragic 10.2% |
| French American Indians | 1.5 /100 | #238 | Tragic 10.2% |
| Potawatomi | 1.5 /100 | #239 | Tragic 10.2% |
| Immigrants | Azores | 1.4 /100 | #240 | Tragic 10.3% |
| Ghanaians | 1.3 /100 | #241 | Tragic 10.3% |
| Alaska Natives | 1.0 /100 | #242 | Tragic 10.4% |
| Nepalese | 0.8 /100 | #243 | Tragic 10.4% |
| Cree | 0.7 /100 | #244 | Tragic 10.5% |
| Immigrants | Burma/Myanmar | 0.6 /100 | #245 | Tragic 10.5% |
| Cherokee | 0.5 /100 | #246 | Tragic 10.6% |
| Liberians | 0.4 /100 | #247 | Tragic 10.6% |
| Nicaraguans | 0.4 /100 | #248 | Tragic 10.6% |
| Cubans | 0.4 /100 | #249 | Tragic 10.6% |
| Salvadorans | 0.3 /100 | #250 | Tragic 10.7% |
Demographics Similar to Immigrants from Austria by Family Poverty
In terms of family poverty, the demographic groups most similar to Immigrants from Austria are Scandinavian (7.6%, a difference of 0.24%), German (7.7%, a difference of 0.29%), Okinawan (7.7%, a difference of 0.41%), Tongan (7.7%, a difference of 0.43%), and Immigrants from Czechoslovakia (7.7%, a difference of 0.44%).
| Demographics | Rating | Rank | Family Poverty |
| Turks | 99.4 /100 | #36 | Exceptional 7.5% |
| Estonians | 99.4 /100 | #37 | Exceptional 7.5% |
| Bolivians | 99.3 /100 | #38 | Exceptional 7.5% |
| Carpatho Rusyns | 99.3 /100 | #39 | Exceptional 7.5% |
| Slovenes | 99.3 /100 | #40 | Exceptional 7.5% |
| Immigrants | Australia | 99.2 /100 | #41 | Exceptional 7.6% |
| Scandinavians | 99.1 /100 | #42 | Exceptional 7.6% |
| Immigrants | Austria | 99.1 /100 | #43 | Exceptional 7.6% |
| Germans | 99.0 /100 | #44 | Exceptional 7.7% |
| Okinawans | 98.9 /100 | #45 | Exceptional 7.7% |
| Tongans | 98.9 /100 | #46 | Exceptional 7.7% |
| Immigrants | Czechoslovakia | 98.9 /100 | #47 | Exceptional 7.7% |
| Immigrants | Sri Lanka | 98.9 /100 | #48 | Exceptional 7.7% |
| Immigrants | Bolivia | 98.9 /100 | #49 | Exceptional 7.7% |
| Immigrants | North Macedonia | 98.9 /100 | #50 | Exceptional 7.7% |