Immigrants from Sri Lanka vs Canadian Family Poverty
COMPARE
Immigrants from Sri Lanka
Canadian
Family Poverty
Family Poverty Comparison
Immigrants from Sri Lanka
Canadians
7.7%
FAMILY POVERTY
98.9/ 100
METRIC RATING
48th/ 347
METRIC RANK
8.2%
FAMILY POVERTY
94.2/ 100
METRIC RATING
113th/ 347
METRIC RANK
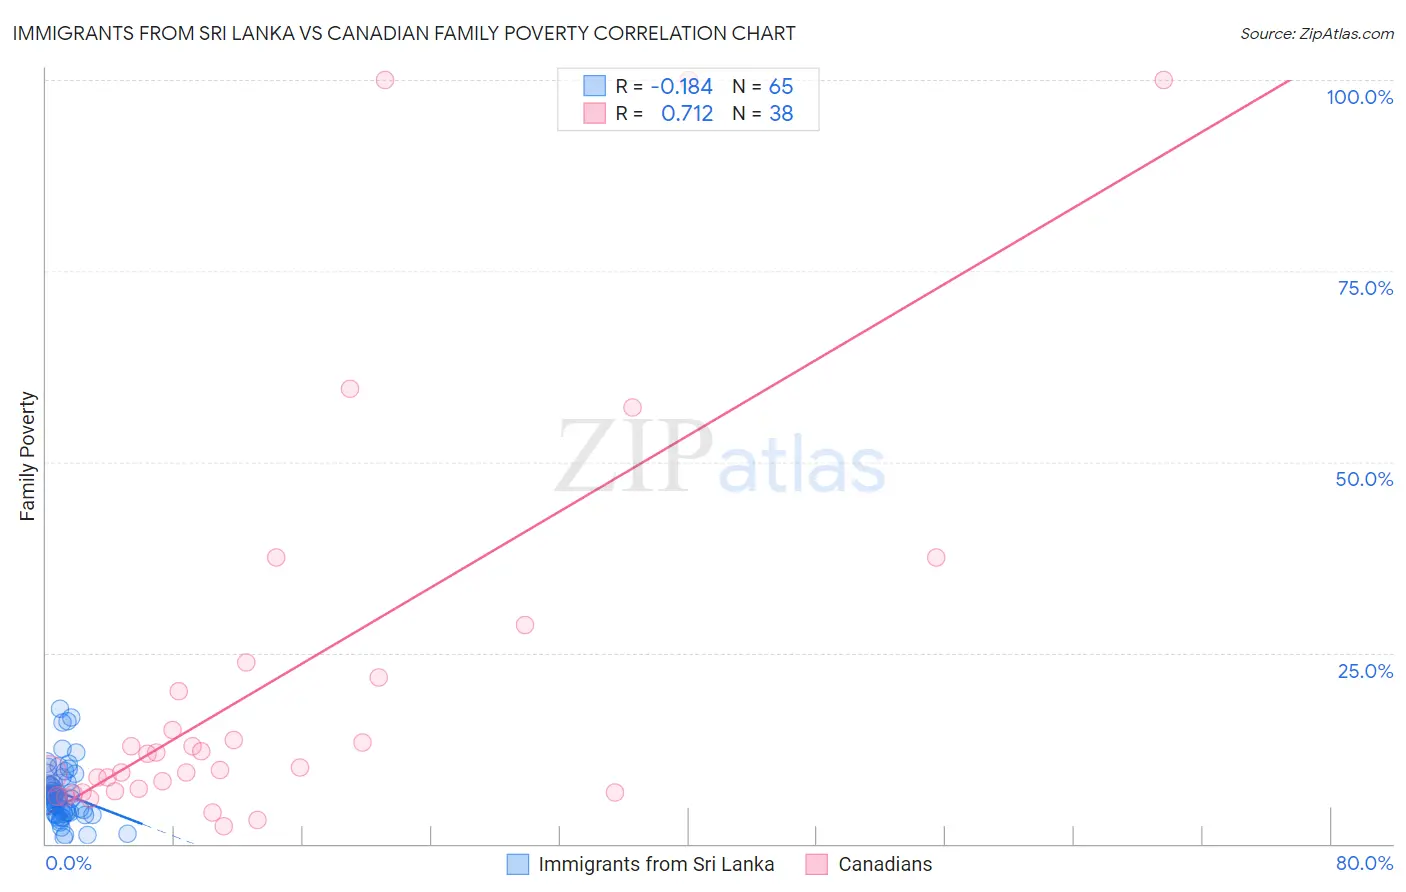
Immigrants from Sri Lanka vs Canadian Family Poverty Correlation Chart
The statistical analysis conducted on geographies consisting of 149,580,330 people shows a poor negative correlation between the proportion of Immigrants from Sri Lanka and poverty level among families in the United States with a correlation coefficient (R) of -0.184 and weighted average of 7.7%. Similarly, the statistical analysis conducted on geographies consisting of 435,772,566 people shows a strong positive correlation between the proportion of Canadians and poverty level among families in the United States with a correlation coefficient (R) of 0.712 and weighted average of 8.2%, a difference of 6.7%.
Family Poverty Correlation Summary
| Measurement | Immigrants from Sri Lanka | Canadian |
| Minimum | 0.89% | 2.3% |
| Maximum | 17.7% | 100.0% |
| Range | 16.8% | 97.7% |
| Mean | 6.6% | 21.7% |
| Median | 6.1% | 10.9% |
| Interquartile 25% (IQ1) | 4.1% | 6.9% |
| Interquartile 75% (IQ3) | 8.0% | 21.7% |
| Interquartile Range (IQR) | 3.9% | 14.9% |
| Standard Deviation (Sample) | 3.6% | 26.7% |
| Standard Deviation (Population) | 3.6% | 26.4% |
Similar Demographics by Family Poverty
Demographics Similar to Immigrants from Sri Lanka by Family Poverty
In terms of family poverty, the demographic groups most similar to Immigrants from Sri Lanka are Immigrants from Czechoslovakia (7.7%, a difference of 0.020%), Tongan (7.7%, a difference of 0.030%), Okinawan (7.7%, a difference of 0.040%), German (7.7%, a difference of 0.17%), and Immigrants from Bolivia (7.7%, a difference of 0.19%).
| Demographics | Rating | Rank | Family Poverty |
| Immigrants | Australia | 99.2 /100 | #41 | Exceptional 7.6% |
| Scandinavians | 99.1 /100 | #42 | Exceptional 7.6% |
| Immigrants | Austria | 99.1 /100 | #43 | Exceptional 7.6% |
| Germans | 99.0 /100 | #44 | Exceptional 7.7% |
| Okinawans | 98.9 /100 | #45 | Exceptional 7.7% |
| Tongans | 98.9 /100 | #46 | Exceptional 7.7% |
| Immigrants | Czechoslovakia | 98.9 /100 | #47 | Exceptional 7.7% |
| Immigrants | Sri Lanka | 98.9 /100 | #48 | Exceptional 7.7% |
| Immigrants | Bolivia | 98.9 /100 | #49 | Exceptional 7.7% |
| Immigrants | North Macedonia | 98.9 /100 | #50 | Exceptional 7.7% |
| Immigrants | Moldova | 98.8 /100 | #51 | Exceptional 7.7% |
| Indians (Asian) | 98.8 /100 | #52 | Exceptional 7.7% |
| Swiss | 98.8 /100 | #53 | Exceptional 7.7% |
| Immigrants | Sweden | 98.8 /100 | #54 | Exceptional 7.7% |
| Immigrants | Eastern Asia | 98.7 /100 | #55 | Exceptional 7.7% |
Demographics Similar to Canadians by Family Poverty
In terms of family poverty, the demographic groups most similar to Canadians are Immigrants from Zimbabwe (8.2%, a difference of 0.090%), Immigrants from France (8.2%, a difference of 0.17%), Taiwanese (8.2%, a difference of 0.28%), Romanian (8.2%, a difference of 0.33%), and Jordanian (8.2%, a difference of 0.42%).
| Demographics | Rating | Rank | Family Poverty |
| Egyptians | 95.1 /100 | #106 | Exceptional 8.1% |
| French Canadians | 95.0 /100 | #107 | Exceptional 8.1% |
| Basques | 94.9 /100 | #108 | Exceptional 8.1% |
| Jordanians | 94.8 /100 | #109 | Exceptional 8.2% |
| Romanians | 94.7 /100 | #110 | Exceptional 8.2% |
| Taiwanese | 94.6 /100 | #111 | Exceptional 8.2% |
| Immigrants | France | 94.4 /100 | #112 | Exceptional 8.2% |
| Canadians | 94.2 /100 | #113 | Exceptional 8.2% |
| Immigrants | Zimbabwe | 94.0 /100 | #114 | Exceptional 8.2% |
| Immigrants | Israel | 93.5 /100 | #115 | Exceptional 8.2% |
| South Africans | 93.4 /100 | #116 | Exceptional 8.2% |
| Immigrants | Russia | 93.2 /100 | #117 | Exceptional 8.2% |
| Immigrants | Western Europe | 92.9 /100 | #118 | Exceptional 8.2% |
| French | 92.8 /100 | #119 | Exceptional 8.3% |
| Immigrants | Egypt | 91.6 /100 | #120 | Exceptional 8.3% |