Ghanaian vs Cambodian Seniors Poverty Over the Age of 65
COMPARE
Ghanaian
Cambodian
Seniors Poverty Over the Age of 65
Seniors Poverty Over the Age of 65 Comparison
Ghanaians
Cambodians
12.4%
SENIORS POVERTY OVER THE AGE OF 65
0.2/ 100
METRIC RATING
259th/ 347
METRIC RANK
10.4%
SENIORS POVERTY OVER THE AGE OF 65
89.1/ 100
METRIC RATING
127th/ 347
METRIC RANK
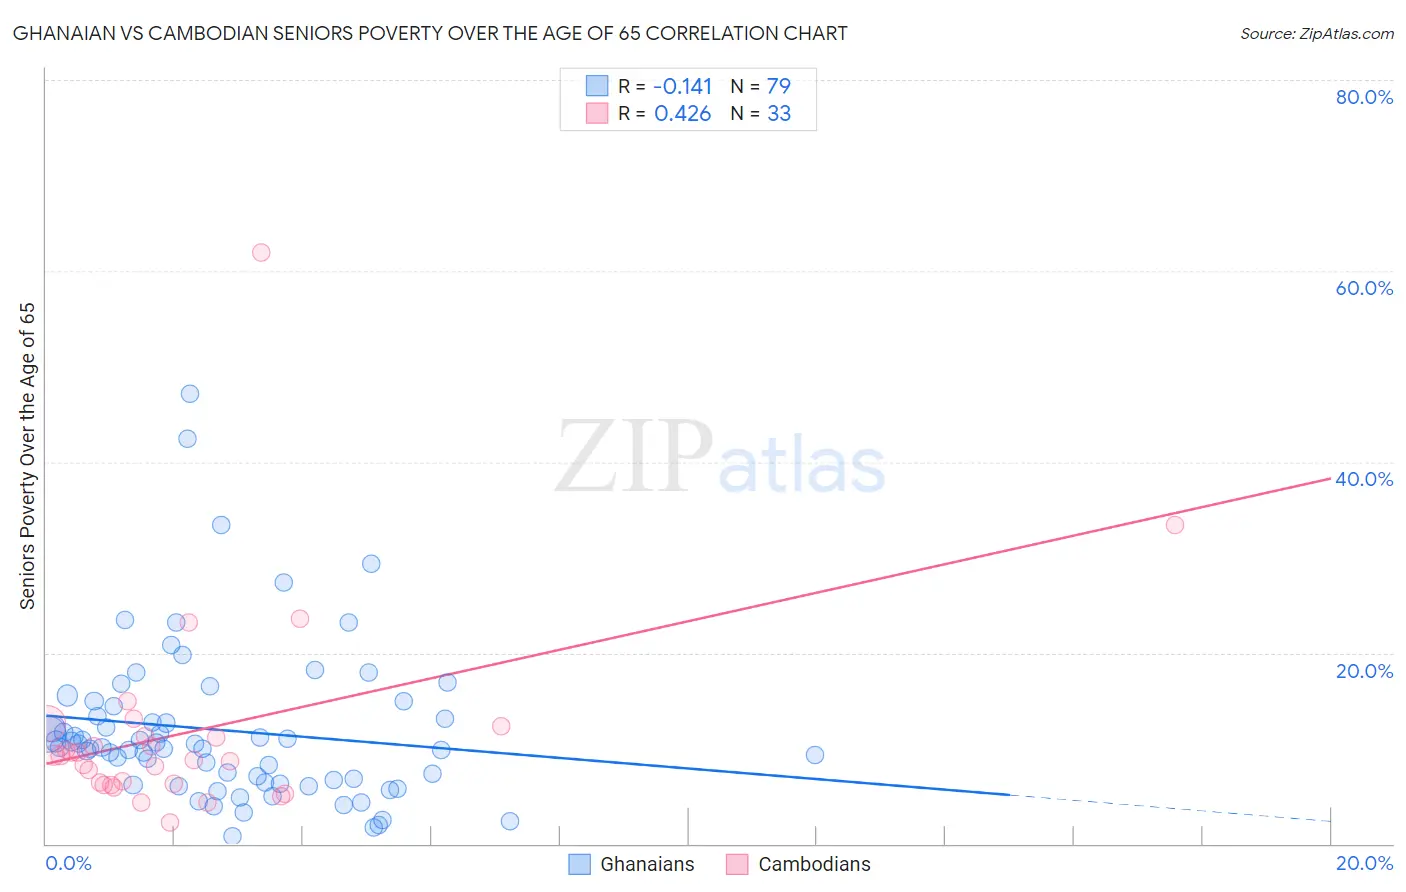
Ghanaian vs Cambodian Seniors Poverty Over the Age of 65 Correlation Chart
The statistical analysis conducted on geographies consisting of 190,048,350 people shows a poor negative correlation between the proportion of Ghanaians and poverty level among seniors over the age of 65 in the United States with a correlation coefficient (R) of -0.141 and weighted average of 12.4%. Similarly, the statistical analysis conducted on geographies consisting of 102,369,516 people shows a moderate positive correlation between the proportion of Cambodians and poverty level among seniors over the age of 65 in the United States with a correlation coefficient (R) of 0.426 and weighted average of 10.4%, a difference of 19.4%.
Seniors Poverty Over the Age of 65 Correlation Summary
| Measurement | Ghanaian | Cambodian |
| Minimum | 0.81% | 2.3% |
| Maximum | 47.2% | 61.9% |
| Range | 46.4% | 59.7% |
| Mean | 11.9% | 11.7% |
| Median | 10.1% | 9.3% |
| Interquartile 25% (IQ1) | 6.5% | 6.2% |
| Interquartile 75% (IQ3) | 14.5% | 11.8% |
| Interquartile Range (IQR) | 8.0% | 5.6% |
| Standard Deviation (Sample) | 8.3% | 10.9% |
| Standard Deviation (Population) | 8.2% | 10.8% |
Similar Demographics by Seniors Poverty Over the Age of 65
Demographics Similar to Ghanaians by Seniors Poverty Over the Age of 65
In terms of seniors poverty over the age of 65, the demographic groups most similar to Ghanaians are Dutch West Indian (12.4%, a difference of 0.030%), South American (12.5%, a difference of 0.24%), Immigrants from Panama (12.4%, a difference of 0.28%), Immigrants (12.4%, a difference of 0.28%), and Colombian (12.5%, a difference of 0.48%).
| Demographics | Rating | Rank | Seniors Poverty Over the Age of 65 |
| Armenians | 0.3 /100 | #252 | Tragic 12.3% |
| Shoshone | 0.3 /100 | #253 | Tragic 12.3% |
| Immigrants | Cambodia | 0.3 /100 | #254 | Tragic 12.4% |
| Mexican American Indians | 0.3 /100 | #255 | Tragic 12.4% |
| Immigrants | Panama | 0.2 /100 | #256 | Tragic 12.4% |
| Immigrants | Immigrants | 0.2 /100 | #257 | Tragic 12.4% |
| Dutch West Indians | 0.2 /100 | #258 | Tragic 12.4% |
| Ghanaians | 0.2 /100 | #259 | Tragic 12.4% |
| South Americans | 0.2 /100 | #260 | Tragic 12.5% |
| Colombians | 0.2 /100 | #261 | Tragic 12.5% |
| Venezuelans | 0.1 /100 | #262 | Tragic 12.5% |
| Soviet Union | 0.1 /100 | #263 | Tragic 12.6% |
| Inupiat | 0.1 /100 | #264 | Tragic 12.6% |
| Immigrants | Western Africa | 0.1 /100 | #265 | Tragic 12.6% |
| Africans | 0.1 /100 | #266 | Tragic 12.6% |
Demographics Similar to Cambodians by Seniors Poverty Over the Age of 65
In terms of seniors poverty over the age of 65, the demographic groups most similar to Cambodians are Immigrants from Hungary (10.4%, a difference of 0.0%), Immigrants from Philippines (10.4%, a difference of 0.070%), Ottawa (10.4%, a difference of 0.13%), Immigrants from Iran (10.4%, a difference of 0.15%), and Immigrants from Oceania (10.4%, a difference of 0.15%).
| Demographics | Rating | Rank | Seniors Poverty Over the Age of 65 |
| Immigrants | Bosnia and Herzegovina | 90.8 /100 | #120 | Exceptional 10.4% |
| Immigrants | Iraq | 90.7 /100 | #121 | Exceptional 10.4% |
| Immigrants | Moldova | 90.7 /100 | #122 | Exceptional 10.4% |
| Hmong | 90.0 /100 | #123 | Exceptional 10.4% |
| Asians | 89.9 /100 | #124 | Excellent 10.4% |
| Immigrants | Philippines | 89.4 /100 | #125 | Excellent 10.4% |
| Immigrants | Hungary | 89.1 /100 | #126 | Excellent 10.4% |
| Cambodians | 89.1 /100 | #127 | Excellent 10.4% |
| Ottawa | 88.5 /100 | #128 | Excellent 10.4% |
| Immigrants | Iran | 88.4 /100 | #129 | Excellent 10.4% |
| Immigrants | Oceania | 88.4 /100 | #130 | Excellent 10.4% |
| Egyptians | 87.8 /100 | #131 | Excellent 10.5% |
| Immigrants | Turkey | 87.7 /100 | #132 | Excellent 10.5% |
| Guamanians/Chamorros | 87.5 /100 | #133 | Excellent 10.5% |
| Sierra Leoneans | 86.8 /100 | #134 | Excellent 10.5% |