Immigrants from Germany vs Spanish American Child Poverty Under the Age of 16
COMPARE
Immigrants from Germany
Spanish American
Child Poverty Under the Age of 16
Child Poverty Under the Age of 16 Comparison
Immigrants from Germany
Spanish Americans
15.8%
CHILD POVERTY UNDER THE AGE OF 16
67.3/ 100
METRIC RATING
164th/ 347
METRIC RANK
19.2%
CHILD POVERTY UNDER THE AGE OF 16
0.2/ 100
METRIC RATING
258th/ 347
METRIC RANK
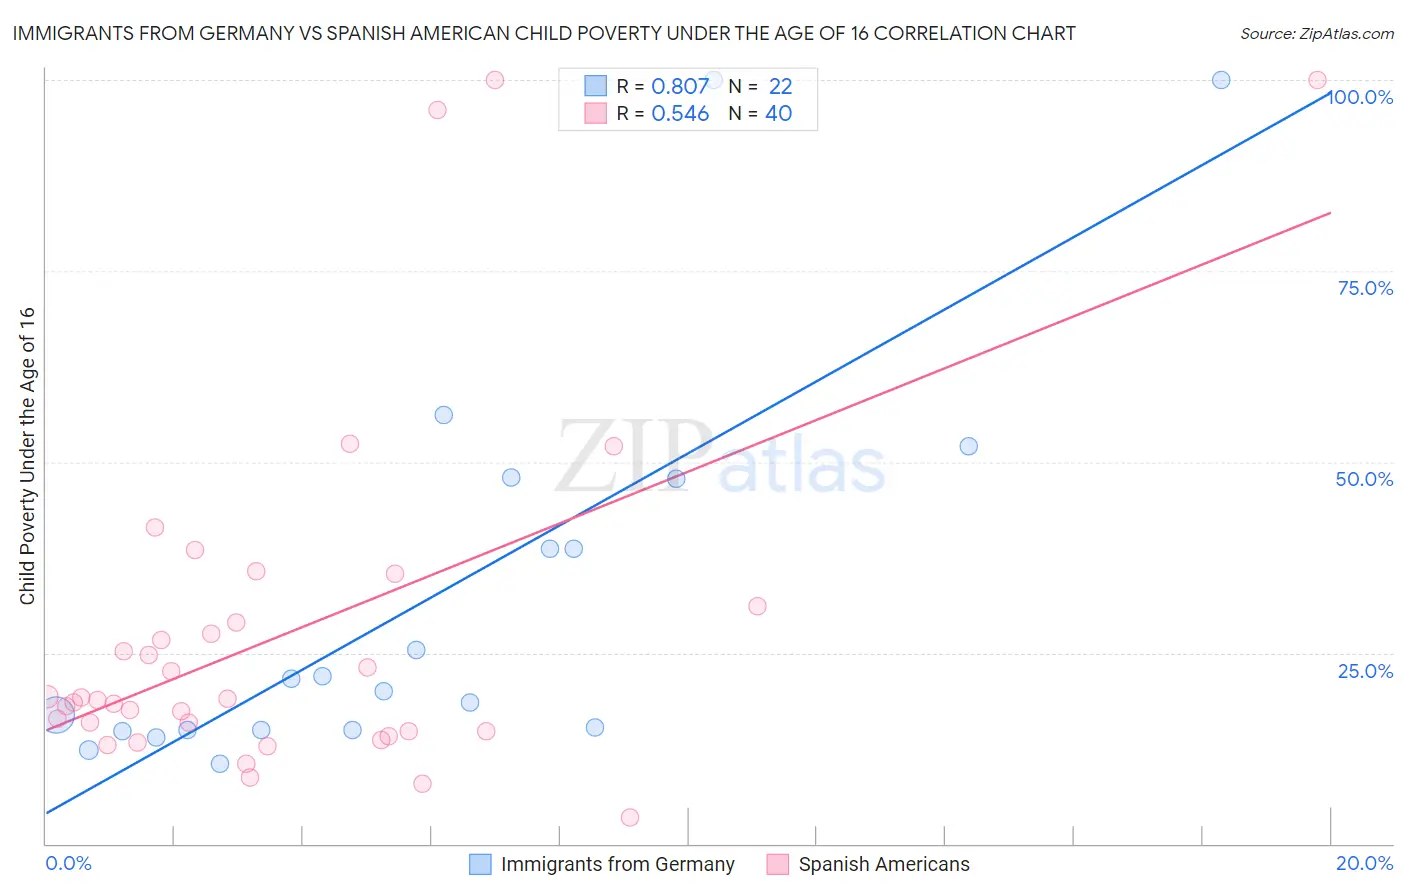
Immigrants from Germany vs Spanish American Child Poverty Under the Age of 16 Correlation Chart
The statistical analysis conducted on geographies consisting of 458,231,020 people shows a very strong positive correlation between the proportion of Immigrants from Germany and poverty level among children under the age of 16 in the United States with a correlation coefficient (R) of 0.807 and weighted average of 15.8%. Similarly, the statistical analysis conducted on geographies consisting of 102,994,758 people shows a substantial positive correlation between the proportion of Spanish Americans and poverty level among children under the age of 16 in the United States with a correlation coefficient (R) of 0.546 and weighted average of 19.2%, a difference of 21.3%.
Child Poverty Under the Age of 16 Correlation Summary
| Measurement | Immigrants from Germany | Spanish American |
| Minimum | 10.5% | 3.4% |
| Maximum | 100.0% | 100.0% |
| Range | 89.5% | 96.6% |
| Mean | 32.6% | 27.5% |
| Median | 20.8% | 18.9% |
| Interquartile 25% (IQ1) | 14.9% | 14.7% |
| Interquartile 75% (IQ3) | 47.8% | 30.1% |
| Interquartile Range (IQR) | 32.9% | 15.4% |
| Standard Deviation (Sample) | 26.1% | 23.2% |
| Standard Deviation (Population) | 25.5% | 22.9% |
Similar Demographics by Child Poverty Under the Age of 16
Demographics Similar to Immigrants from Germany by Child Poverty Under the Age of 16
In terms of child poverty under the age of 16, the demographic groups most similar to Immigrants from Germany are Colombian (15.8%, a difference of 0.040%), Yugoslavian (15.8%, a difference of 0.040%), Immigrants from Northern Africa (15.8%, a difference of 0.10%), Guamanian/Chamorro (15.9%, a difference of 0.13%), and Immigrants from Oceania (15.9%, a difference of 0.27%).
| Demographics | Rating | Rank | Child Poverty Under the Age of 16 |
| Immigrants | Nepal | 72.9 /100 | #157 | Good 15.7% |
| Immigrants | Chile | 72.8 /100 | #158 | Good 15.7% |
| Immigrants | Fiji | 71.1 /100 | #159 | Good 15.8% |
| Immigrants | Albania | 70.7 /100 | #160 | Good 15.8% |
| Immigrants | Northern Africa | 68.1 /100 | #161 | Good 15.8% |
| Colombians | 67.6 /100 | #162 | Good 15.8% |
| Yugoslavians | 67.6 /100 | #163 | Good 15.8% |
| Immigrants | Germany | 67.3 /100 | #164 | Good 15.8% |
| Guamanians/Chamorros | 66.4 /100 | #165 | Good 15.9% |
| Immigrants | Oceania | 65.4 /100 | #166 | Good 15.9% |
| Costa Ricans | 61.1 /100 | #167 | Good 16.0% |
| South Americans | 57.9 /100 | #168 | Average 16.0% |
| Uruguayans | 54.7 /100 | #169 | Average 16.1% |
| Immigrants | Colombia | 54.4 /100 | #170 | Average 16.1% |
| Hungarians | 52.5 /100 | #171 | Average 16.2% |
Demographics Similar to Spanish Americans by Child Poverty Under the Age of 16
In terms of child poverty under the age of 16, the demographic groups most similar to Spanish Americans are Ottawa (19.2%, a difference of 0.080%), Inupiat (19.2%, a difference of 0.090%), Trinidadian and Tobagonian (19.2%, a difference of 0.18%), Immigrants from Western Africa (19.2%, a difference of 0.35%), and Mexican American Indian (19.3%, a difference of 0.55%).
| Demographics | Rating | Rank | Child Poverty Under the Age of 16 |
| Immigrants | Ghana | 0.3 /100 | #251 | Tragic 19.1% |
| Immigrants | Trinidad and Tobago | 0.3 /100 | #252 | Tragic 19.1% |
| Salvadorans | 0.3 /100 | #253 | Tragic 19.1% |
| Immigrants | Western Africa | 0.2 /100 | #254 | Tragic 19.2% |
| Trinidadians and Tobagonians | 0.2 /100 | #255 | Tragic 19.2% |
| Inupiat | 0.2 /100 | #256 | Tragic 19.2% |
| Ottawa | 0.2 /100 | #257 | Tragic 19.2% |
| Spanish Americans | 0.2 /100 | #258 | Tragic 19.2% |
| Mexican American Indians | 0.2 /100 | #259 | Tragic 19.3% |
| Guyanese | 0.2 /100 | #260 | Tragic 19.3% |
| Immigrants | Burma/Myanmar | 0.1 /100 | #261 | Tragic 19.4% |
| Immigrants | Guyana | 0.1 /100 | #262 | Tragic 19.4% |
| Vietnamese | 0.1 /100 | #263 | Tragic 19.4% |
| Immigrants | Ecuador | 0.1 /100 | #264 | Tragic 19.4% |
| Chickasaw | 0.1 /100 | #265 | Tragic 19.5% |