Bahamian vs Immigrants from Singapore Single Male Poverty
COMPARE
Bahamian
Immigrants from Singapore
Single Male Poverty
Single Male Poverty Comparison
Bahamians
Immigrants from Singapore
14.6%
SINGLE MALE POVERTY
0.0/ 100
METRIC RATING
291st/ 347
METRIC RANK
11.4%
SINGLE MALE POVERTY
100.0/ 100
METRIC RATING
37th/ 347
METRIC RANK
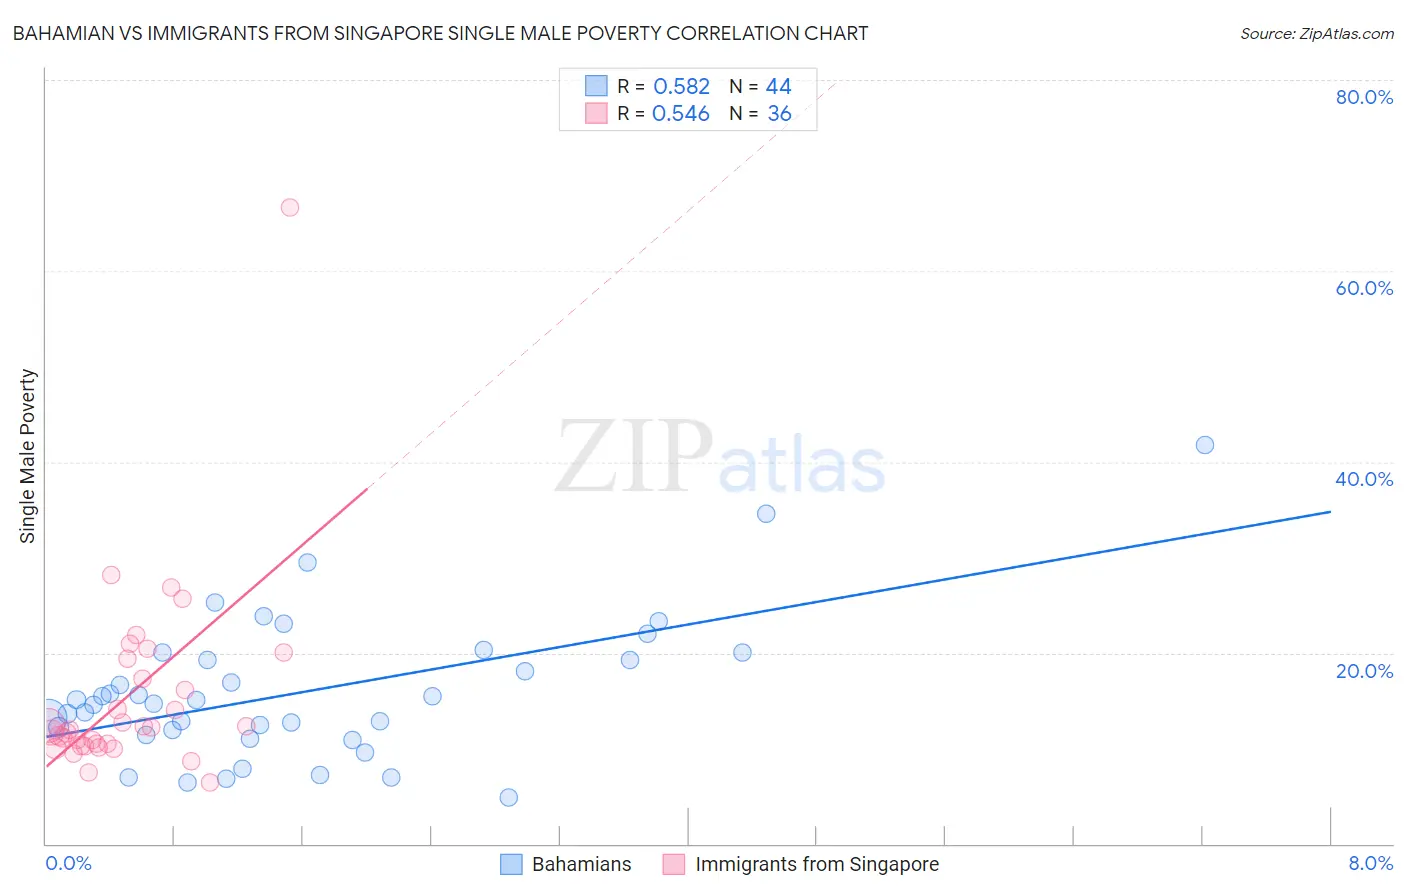
Bahamian vs Immigrants from Singapore Single Male Poverty Correlation Chart
The statistical analysis conducted on geographies consisting of 108,151,039 people shows a substantial positive correlation between the proportion of Bahamians and poverty level among single males in the United States with a correlation coefficient (R) of 0.582 and weighted average of 14.6%. Similarly, the statistical analysis conducted on geographies consisting of 128,964,447 people shows a substantial positive correlation between the proportion of Immigrants from Singapore and poverty level among single males in the United States with a correlation coefficient (R) of 0.546 and weighted average of 11.4%, a difference of 27.1%.
Single Male Poverty Correlation Summary
| Measurement | Bahamian | Immigrants from Singapore |
| Minimum | 4.8% | 6.4% |
| Maximum | 41.8% | 66.7% |
| Range | 37.0% | 60.3% |
| Mean | 15.9% | 15.4% |
| Median | 14.8% | 12.1% |
| Interquartile 25% (IQ1) | 11.7% | 10.4% |
| Interquartile 75% (IQ3) | 19.6% | 18.3% |
| Interquartile Range (IQR) | 7.9% | 8.0% |
| Standard Deviation (Sample) | 7.4% | 10.3% |
| Standard Deviation (Population) | 7.4% | 10.2% |
Similar Demographics by Single Male Poverty
Demographics Similar to Bahamians by Single Male Poverty
In terms of single male poverty, the demographic groups most similar to Bahamians are Nonimmigrants (14.6%, a difference of 0.13%), U.S. Virgin Islander (14.5%, a difference of 0.15%), French Canadian (14.6%, a difference of 0.25%), Immigrants from Dominica (14.5%, a difference of 0.38%), and Ottawa (14.6%, a difference of 0.43%).
| Demographics | Rating | Rank | Single Male Poverty |
| Immigrants | Bahamas | 0.0 /100 | #284 | Tragic 14.4% |
| French | 0.0 /100 | #285 | Tragic 14.4% |
| Celtics | 0.0 /100 | #286 | Tragic 14.5% |
| Iroquois | 0.0 /100 | #287 | Tragic 14.5% |
| Whites/Caucasians | 0.0 /100 | #288 | Tragic 14.5% |
| Immigrants | Dominica | 0.0 /100 | #289 | Tragic 14.5% |
| U.S. Virgin Islanders | 0.0 /100 | #290 | Tragic 14.5% |
| Bahamians | 0.0 /100 | #291 | Tragic 14.6% |
| Immigrants | Nonimmigrants | 0.0 /100 | #292 | Tragic 14.6% |
| French Canadians | 0.0 /100 | #293 | Tragic 14.6% |
| Ottawa | 0.0 /100 | #294 | Tragic 14.6% |
| Scotch-Irish | 0.0 /100 | #295 | Tragic 14.7% |
| Africans | 0.0 /100 | #296 | Tragic 14.7% |
| Immigrants | Dominican Republic | 0.0 /100 | #297 | Tragic 14.8% |
| French American Indians | 0.0 /100 | #298 | Tragic 15.0% |
Demographics Similar to Immigrants from Singapore by Single Male Poverty
In terms of single male poverty, the demographic groups most similar to Immigrants from Singapore are Immigrants from Serbia (11.4%, a difference of 0.050%), Sri Lankan (11.5%, a difference of 0.060%), Immigrants from South Eastern Asia (11.4%, a difference of 0.080%), Immigrants from Ethiopia (11.4%, a difference of 0.12%), and Soviet Union (11.5%, a difference of 0.15%).
| Demographics | Rating | Rank | Single Male Poverty |
| Iranians | 100.0 /100 | #30 | Exceptional 11.4% |
| Immigrants | Iran | 100.0 /100 | #31 | Exceptional 11.4% |
| Immigrants | Eastern Asia | 100.0 /100 | #32 | Exceptional 11.4% |
| Immigrants | Vietnam | 100.0 /100 | #33 | Exceptional 11.4% |
| Immigrants | Ethiopia | 100.0 /100 | #34 | Exceptional 11.4% |
| Immigrants | South Eastern Asia | 100.0 /100 | #35 | Exceptional 11.4% |
| Immigrants | Serbia | 100.0 /100 | #36 | Exceptional 11.4% |
| Immigrants | Singapore | 100.0 /100 | #37 | Exceptional 11.4% |
| Sri Lankans | 100.0 /100 | #38 | Exceptional 11.5% |
| Soviet Union | 100.0 /100 | #39 | Exceptional 11.5% |
| Immigrants | Korea | 100.0 /100 | #40 | Exceptional 11.5% |
| Immigrants | Iraq | 99.9 /100 | #41 | Exceptional 11.5% |
| Egyptians | 99.9 /100 | #42 | Exceptional 11.5% |
| Immigrants | Peru | 99.9 /100 | #43 | Exceptional 11.5% |
| Immigrants | Cameroon | 99.9 /100 | #44 | Exceptional 11.5% |