Immigrants from Colombia vs Spanish American Female Poverty Among 18-24 Year Olds
COMPARE
Immigrants from Colombia
Spanish American
Female Poverty Among 18-24 Year Olds
Female Poverty Among 18-24 Year Olds Comparison
Immigrants from Colombia
Spanish Americans
17.3%
FEMALE POVERTY AMONG 18-24 YEAR OLDS
100.0/ 100
METRIC RATING
18th/ 347
METRIC RANK
21.9%
FEMALE POVERTY AMONG 18-24 YEAR OLDS
0.1/ 100
METRIC RATING
279th/ 347
METRIC RANK
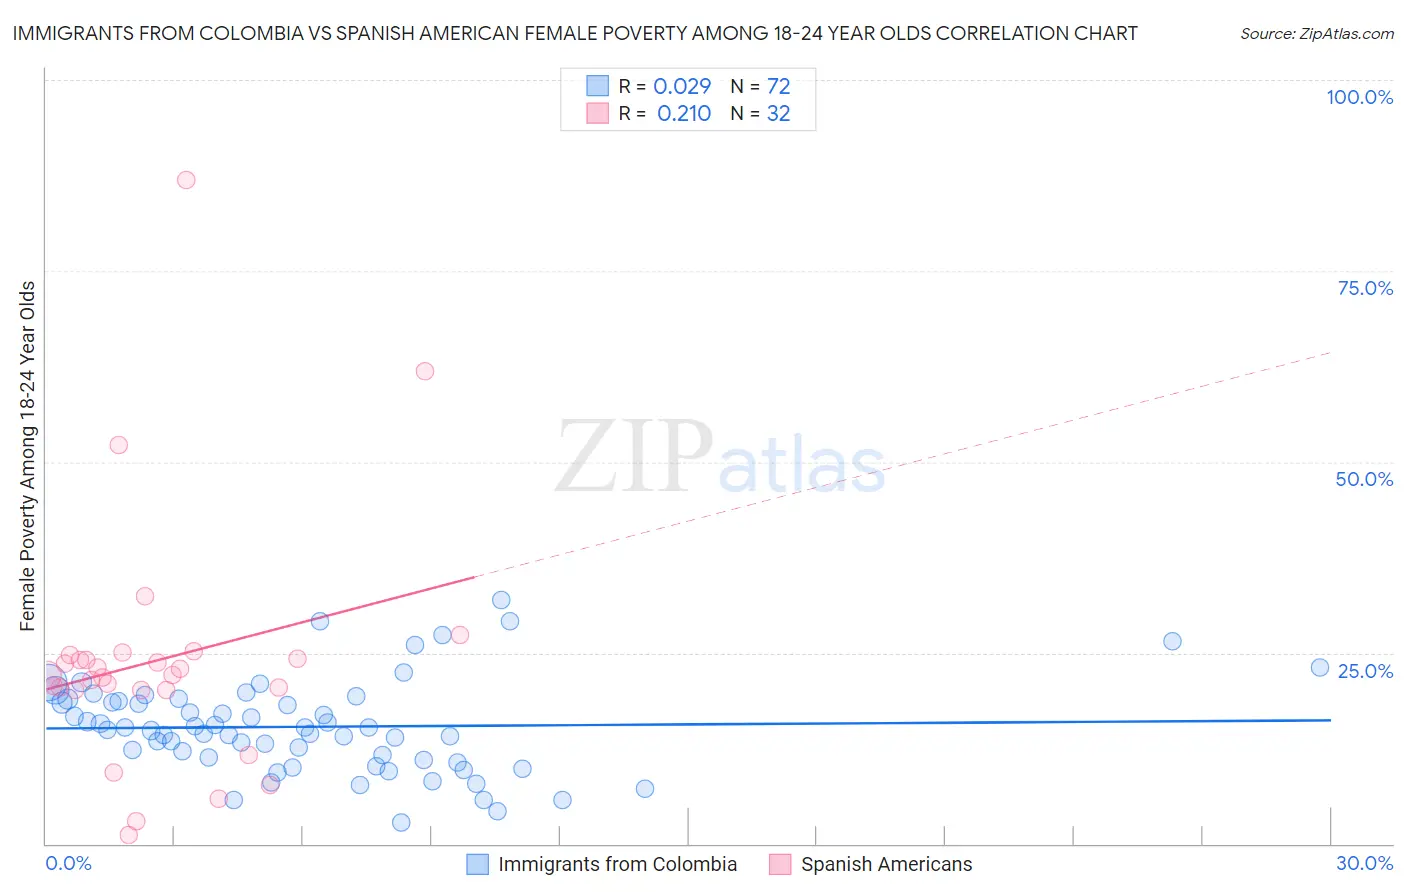
Immigrants from Colombia vs Spanish American Female Poverty Among 18-24 Year Olds Correlation Chart
The statistical analysis conducted on geographies consisting of 369,842,642 people shows no correlation between the proportion of Immigrants from Colombia and poverty level among females between the ages 18 and 24 in the United States with a correlation coefficient (R) of 0.029 and weighted average of 17.3%. Similarly, the statistical analysis conducted on geographies consisting of 102,596,848 people shows a weak positive correlation between the proportion of Spanish Americans and poverty level among females between the ages 18 and 24 in the United States with a correlation coefficient (R) of 0.210 and weighted average of 21.9%, a difference of 26.4%.
Female Poverty Among 18-24 Year Olds Correlation Summary
| Measurement | Immigrants from Colombia | Spanish American |
| Minimum | 2.8% | 1.1% |
| Maximum | 32.0% | 87.0% |
| Range | 29.2% | 85.8% |
| Mean | 15.3% | 24.1% |
| Median | 15.0% | 22.1% |
| Interquartile 25% (IQ1) | 11.2% | 20.2% |
| Interquartile 75% (IQ3) | 18.9% | 24.5% |
| Interquartile Range (IQR) | 7.7% | 4.3% |
| Standard Deviation (Sample) | 6.0% | 16.4% |
| Standard Deviation (Population) | 6.0% | 16.1% |
Similar Demographics by Female Poverty Among 18-24 Year Olds
Demographics Similar to Immigrants from Colombia by Female Poverty Among 18-24 Year Olds
In terms of female poverty among 18-24 year olds, the demographic groups most similar to Immigrants from Colombia are Immigrants from Lithuania (17.4%, a difference of 0.41%), Immigrants from Taiwan (17.3%, a difference of 0.46%), Immigrants from Venezuela (17.4%, a difference of 0.54%), Bolivian (17.4%, a difference of 0.54%), and Immigrants from Hong Kong (17.5%, a difference of 0.64%).
| Demographics | Rating | Rank | Female Poverty Among 18-24 Year Olds |
| Thais | 100.0 /100 | #11 | Exceptional 17.0% |
| Immigrants | Pakistan | 100.0 /100 | #12 | Exceptional 17.0% |
| Immigrants | Poland | 100.0 /100 | #13 | Exceptional 17.1% |
| Tongans | 100.0 /100 | #14 | Exceptional 17.1% |
| Cubans | 100.0 /100 | #15 | Exceptional 17.2% |
| Peruvians | 100.0 /100 | #16 | Exceptional 17.2% |
| Immigrants | Taiwan | 100.0 /100 | #17 | Exceptional 17.3% |
| Immigrants | Colombia | 100.0 /100 | #18 | Exceptional 17.3% |
| Immigrants | Lithuania | 100.0 /100 | #19 | Exceptional 17.4% |
| Immigrants | Venezuela | 100.0 /100 | #20 | Exceptional 17.4% |
| Bolivians | 100.0 /100 | #21 | Exceptional 17.4% |
| Immigrants | Hong Kong | 100.0 /100 | #22 | Exceptional 17.5% |
| Immigrants | North Macedonia | 100.0 /100 | #23 | Exceptional 17.6% |
| Maltese | 100.0 /100 | #24 | Exceptional 17.6% |
| Immigrants | South Central Asia | 100.0 /100 | #25 | Exceptional 17.6% |
Demographics Similar to Spanish Americans by Female Poverty Among 18-24 Year Olds
In terms of female poverty among 18-24 year olds, the demographic groups most similar to Spanish Americans are Immigrants from Dominica (21.9%, a difference of 0.010%), Immigrants from Dominican Republic (21.9%, a difference of 0.050%), Bermudan (21.9%, a difference of 0.14%), Yaqui (21.9%, a difference of 0.17%), and Immigrants from Switzerland (21.8%, a difference of 0.43%).
| Demographics | Rating | Rank | Female Poverty Among 18-24 Year Olds |
| Basques | 0.2 /100 | #272 | Tragic 21.7% |
| New Zealanders | 0.2 /100 | #273 | Tragic 21.7% |
| Immigrants | Honduras | 0.1 /100 | #274 | Tragic 21.8% |
| Immigrants | Bangladesh | 0.1 /100 | #275 | Tragic 21.8% |
| Bahamians | 0.1 /100 | #276 | Tragic 21.8% |
| Immigrants | Switzerland | 0.1 /100 | #277 | Tragic 21.8% |
| Yaqui | 0.1 /100 | #278 | Tragic 21.9% |
| Spanish Americans | 0.1 /100 | #279 | Tragic 21.9% |
| Immigrants | Dominica | 0.1 /100 | #280 | Tragic 21.9% |
| Immigrants | Dominican Republic | 0.1 /100 | #281 | Tragic 21.9% |
| Bermudans | 0.1 /100 | #282 | Tragic 21.9% |
| Sub-Saharan Africans | 0.0 /100 | #283 | Tragic 22.0% |
| Tlingit-Haida | 0.0 /100 | #284 | Tragic 22.0% |
| Ottawa | 0.0 /100 | #285 | Tragic 22.0% |
| Ugandans | 0.0 /100 | #286 | Tragic 22.1% |