Asian vs French Canadian Male Poverty
COMPARE
Asian
French Canadian
Male Poverty
Male Poverty Comparison
Asians
French Canadians
10.0%
MALE POVERTY
98.7/ 100
METRIC RATING
52nd/ 347
METRIC RANK
10.5%
MALE POVERTY
91.9/ 100
METRIC RATING
102nd/ 347
METRIC RANK
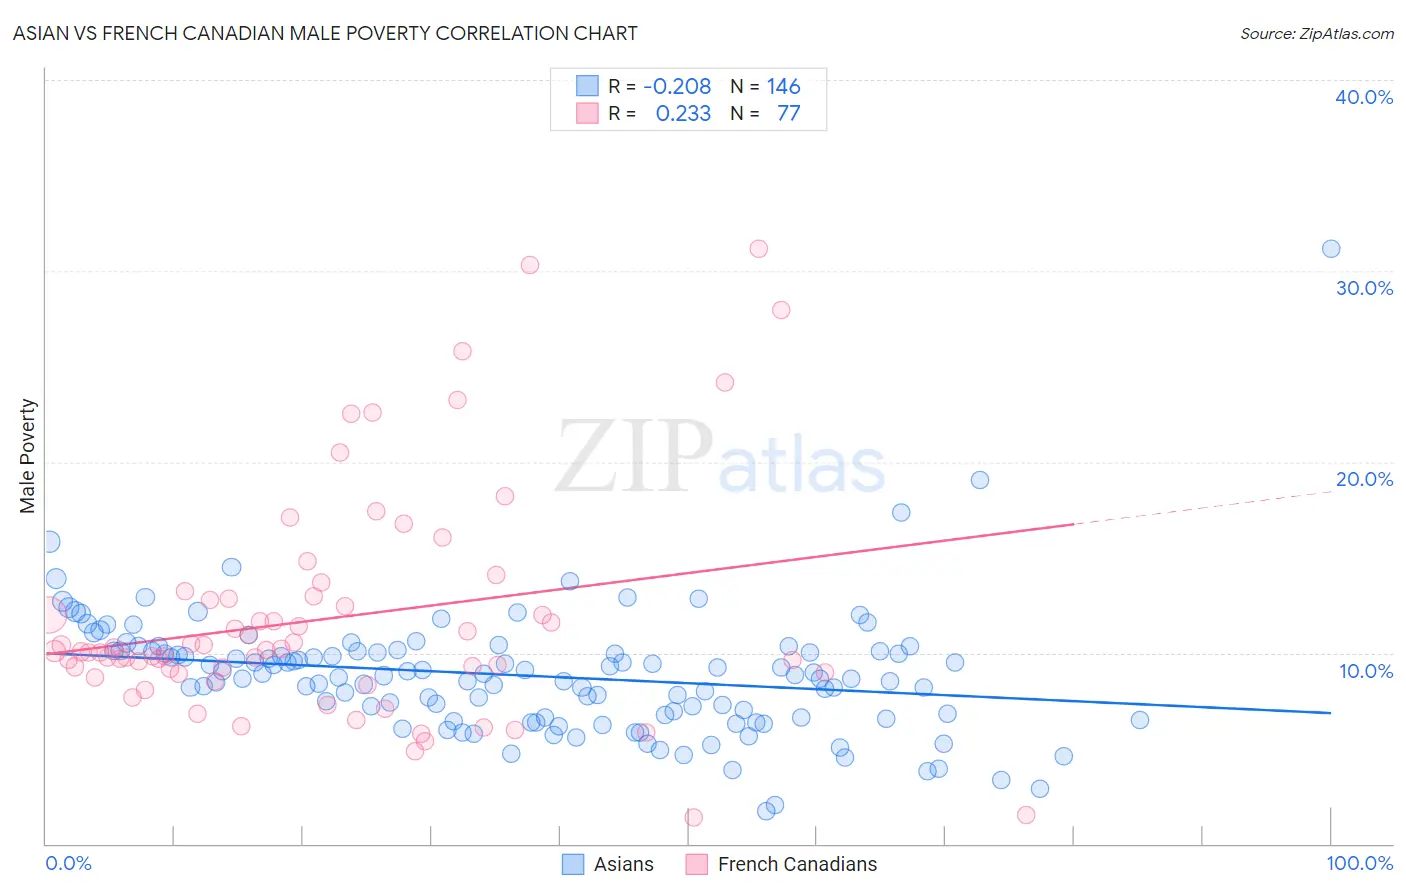
Asian vs French Canadian Male Poverty Correlation Chart
The statistical analysis conducted on geographies consisting of 549,643,011 people shows a weak negative correlation between the proportion of Asians and poverty level among males in the United States with a correlation coefficient (R) of -0.208 and weighted average of 10.0%. Similarly, the statistical analysis conducted on geographies consisting of 501,843,843 people shows a weak positive correlation between the proportion of French Canadians and poverty level among males in the United States with a correlation coefficient (R) of 0.233 and weighted average of 10.5%, a difference of 5.1%.
Male Poverty Correlation Summary
| Measurement | Asian | French Canadian |
| Minimum | 1.7% | 1.4% |
| Maximum | 31.2% | 31.1% |
| Range | 29.4% | 29.8% |
| Mean | 8.8% | 11.8% |
| Median | 8.8% | 10.1% |
| Interquartile 25% (IQ1) | 6.6% | 8.9% |
| Interquartile 75% (IQ3) | 10.1% | 12.9% |
| Interquartile Range (IQR) | 3.5% | 4.0% |
| Standard Deviation (Sample) | 3.3% | 5.9% |
| Standard Deviation (Population) | 3.3% | 5.9% |
Similar Demographics by Male Poverty
Demographics Similar to Asians by Male Poverty
In terms of male poverty, the demographic groups most similar to Asians are Immigrants from Czechoslovakia (10.0%, a difference of 0.070%), Immigrants from Croatia (10.0%, a difference of 0.090%), Immigrants from Philippines (10.0%, a difference of 0.19%), Slovene (10.0%, a difference of 0.24%), and Immigrants from Singapore (10.0%, a difference of 0.34%).
| Demographics | Rating | Rank | Male Poverty |
| Immigrants | Serbia | 98.9 /100 | #45 | Exceptional 10.0% |
| Turks | 98.9 /100 | #46 | Exceptional 10.0% |
| Immigrants | Singapore | 98.8 /100 | #47 | Exceptional 10.0% |
| Immigrants | Japan | 98.8 /100 | #48 | Exceptional 10.0% |
| Slovenes | 98.8 /100 | #49 | Exceptional 10.0% |
| Immigrants | Philippines | 98.7 /100 | #50 | Exceptional 10.0% |
| Immigrants | Croatia | 98.7 /100 | #51 | Exceptional 10.0% |
| Asians | 98.7 /100 | #52 | Exceptional 10.0% |
| Immigrants | Czechoslovakia | 98.6 /100 | #53 | Exceptional 10.0% |
| Immigrants | Austria | 98.5 /100 | #54 | Exceptional 10.0% |
| Germans | 98.3 /100 | #55 | Exceptional 10.1% |
| Immigrants | Bulgaria | 98.2 /100 | #56 | Exceptional 10.1% |
| Estonians | 98.1 /100 | #57 | Exceptional 10.1% |
| Scandinavians | 98.0 /100 | #58 | Exceptional 10.1% |
| Immigrants | Europe | 97.9 /100 | #59 | Exceptional 10.1% |
Demographics Similar to French Canadians by Male Poverty
In terms of male poverty, the demographic groups most similar to French Canadians are Immigrants from Zimbabwe (10.5%, a difference of 0.010%), Slavic (10.5%, a difference of 0.10%), Welsh (10.5%, a difference of 0.11%), Canadian (10.5%, a difference of 0.12%), and Immigrants from Southern Europe (10.5%, a difference of 0.23%).
| Demographics | Rating | Rank | Male Poverty |
| Scottish | 94.0 /100 | #95 | Exceptional 10.4% |
| Immigrants | Egypt | 93.7 /100 | #96 | Exceptional 10.4% |
| Romanians | 93.6 /100 | #97 | Exceptional 10.5% |
| Finns | 93.4 /100 | #98 | Exceptional 10.5% |
| Immigrants | Indonesia | 93.3 /100 | #99 | Exceptional 10.5% |
| Immigrants | Latvia | 92.8 /100 | #100 | Exceptional 10.5% |
| Immigrants | Zimbabwe | 92.0 /100 | #101 | Exceptional 10.5% |
| French Canadians | 91.9 /100 | #102 | Exceptional 10.5% |
| Slavs | 91.7 /100 | #103 | Exceptional 10.5% |
| Welsh | 91.6 /100 | #104 | Exceptional 10.5% |
| Canadians | 91.6 /100 | #105 | Exceptional 10.5% |
| Immigrants | Southern Europe | 91.3 /100 | #106 | Exceptional 10.5% |
| Laotians | 91.2 /100 | #107 | Exceptional 10.5% |
| Portuguese | 91.0 /100 | #108 | Exceptional 10.6% |
| Albanians | 90.6 /100 | #109 | Exceptional 10.6% |