Asian vs Immigrants from Egypt Child Poverty Among Boys Under 16
COMPARE
Asian
Immigrants from Egypt
Child Poverty Among Boys Under 16
Child Poverty Among Boys Under 16 Comparison
Asians
Immigrants from Egypt
13.5%
CHILD POVERTY AMONG BOYS UNDER 16
99.8/ 100
METRIC RATING
27th/ 347
METRIC RANK
14.9%
CHILD POVERTY AMONG BOYS UNDER 16
96.2/ 100
METRIC RATING
97th/ 347
METRIC RANK
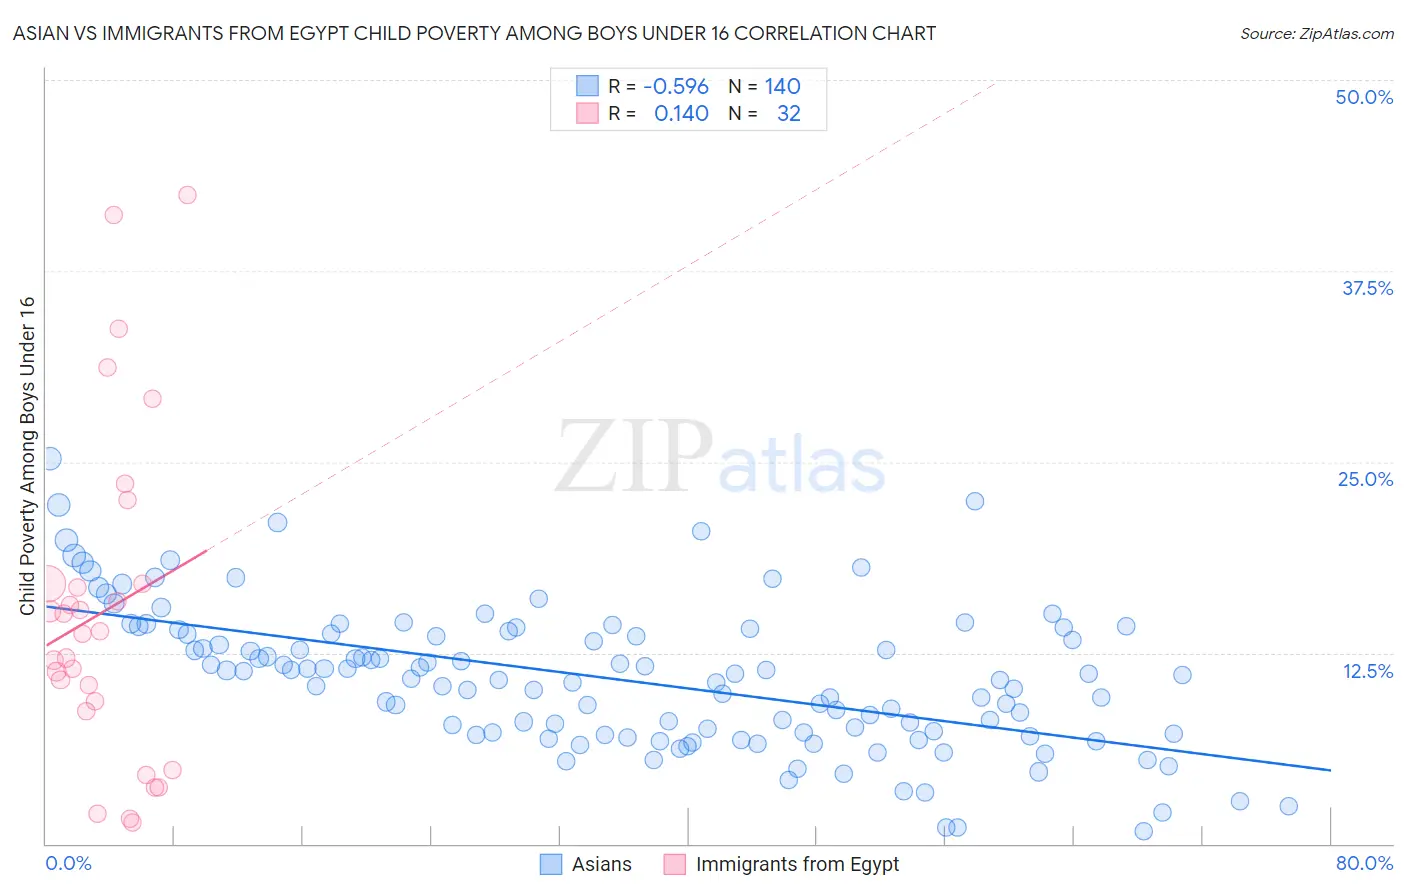
Asian vs Immigrants from Egypt Child Poverty Among Boys Under 16 Correlation Chart
The statistical analysis conducted on geographies consisting of 533,622,634 people shows a substantial negative correlation between the proportion of Asians and poverty level among boys under the age of 16 in the United States with a correlation coefficient (R) of -0.596 and weighted average of 13.5%. Similarly, the statistical analysis conducted on geographies consisting of 242,739,180 people shows a poor positive correlation between the proportion of Immigrants from Egypt and poverty level among boys under the age of 16 in the United States with a correlation coefficient (R) of 0.140 and weighted average of 14.9%, a difference of 10.5%.
Child Poverty Among Boys Under 16 Correlation Summary
| Measurement | Asian | Immigrants from Egypt |
| Minimum | 0.83% | 1.4% |
| Maximum | 25.2% | 42.5% |
| Range | 24.4% | 41.1% |
| Mean | 10.8% | 15.2% |
| Median | 10.9% | 13.8% |
| Interquartile 25% (IQ1) | 7.2% | 9.0% |
| Interquartile 75% (IQ3) | 13.8% | 17.0% |
| Interquartile Range (IQR) | 6.6% | 8.0% |
| Standard Deviation (Sample) | 4.6% | 10.7% |
| Standard Deviation (Population) | 4.6% | 10.5% |
Similar Demographics by Child Poverty Among Boys Under 16
Demographics Similar to Asians by Child Poverty Among Boys Under 16
In terms of child poverty among boys under 16, the demographic groups most similar to Asians are Eastern European (13.5%, a difference of 0.060%), Immigrants from Bolivia (13.5%, a difference of 0.080%), Okinawan (13.5%, a difference of 0.17%), Cypriot (13.6%, a difference of 0.26%), and Immigrants from Lithuania (13.5%, a difference of 0.29%).
| Demographics | Rating | Rank | Child Poverty Among Boys Under 16 |
| Indians (Asian) | 99.9 /100 | #20 | Exceptional 13.3% |
| Immigrants | Eastern Asia | 99.9 /100 | #21 | Exceptional 13.3% |
| Tongans | 99.9 /100 | #22 | Exceptional 13.4% |
| Latvians | 99.9 /100 | #23 | Exceptional 13.4% |
| Immigrants | Lithuania | 99.8 /100 | #24 | Exceptional 13.5% |
| Okinawans | 99.8 /100 | #25 | Exceptional 13.5% |
| Immigrants | Bolivia | 99.8 /100 | #26 | Exceptional 13.5% |
| Asians | 99.8 /100 | #27 | Exceptional 13.5% |
| Eastern Europeans | 99.8 /100 | #28 | Exceptional 13.5% |
| Cypriots | 99.8 /100 | #29 | Exceptional 13.6% |
| Swedes | 99.8 /100 | #30 | Exceptional 13.6% |
| Turks | 99.8 /100 | #31 | Exceptional 13.6% |
| Immigrants | China | 99.8 /100 | #32 | Exceptional 13.6% |
| Danes | 99.8 /100 | #33 | Exceptional 13.6% |
| Assyrians/Chaldeans/Syriacs | 99.8 /100 | #34 | Exceptional 13.6% |
Demographics Similar to Immigrants from Egypt by Child Poverty Among Boys Under 16
In terms of child poverty among boys under 16, the demographic groups most similar to Immigrants from Egypt are Immigrants from North Macedonia (14.9%, a difference of 0.010%), British (15.0%, a difference of 0.040%), Immigrants from France (15.0%, a difference of 0.14%), Finnish (14.9%, a difference of 0.26%), and Sri Lankan (14.9%, a difference of 0.37%).
| Demographics | Rating | Rank | Child Poverty Among Boys Under 16 |
| Austrians | 97.1 /100 | #90 | Exceptional 14.8% |
| Paraguayans | 96.8 /100 | #91 | Exceptional 14.9% |
| Argentineans | 96.7 /100 | #92 | Exceptional 14.9% |
| Sri Lankans | 96.7 /100 | #93 | Exceptional 14.9% |
| Immigrants | Italy | 96.7 /100 | #94 | Exceptional 14.9% |
| Finns | 96.5 /100 | #95 | Exceptional 14.9% |
| Immigrants | North Macedonia | 96.3 /100 | #96 | Exceptional 14.9% |
| Immigrants | Egypt | 96.2 /100 | #97 | Exceptional 14.9% |
| British | 96.2 /100 | #98 | Exceptional 15.0% |
| Immigrants | France | 96.1 /100 | #99 | Exceptional 15.0% |
| Chileans | 95.8 /100 | #100 | Exceptional 15.0% |
| Immigrants | Belarus | 95.7 /100 | #101 | Exceptional 15.0% |
| Romanians | 95.6 /100 | #102 | Exceptional 15.0% |
| Immigrants | Denmark | 95.6 /100 | #103 | Exceptional 15.0% |
| Immigrants | Switzerland | 95.4 /100 | #104 | Exceptional 15.0% |