Asian vs Dutch Child Poverty Among Boys Under 16
COMPARE
Asian
Dutch
Child Poverty Among Boys Under 16
Child Poverty Among Boys Under 16 Comparison
Asians
Dutch
13.5%
CHILD POVERTY AMONG BOYS UNDER 16
99.8/ 100
METRIC RATING
27th/ 347
METRIC RANK
15.0%
CHILD POVERTY AMONG BOYS UNDER 16
95.4/ 100
METRIC RATING
105th/ 347
METRIC RANK
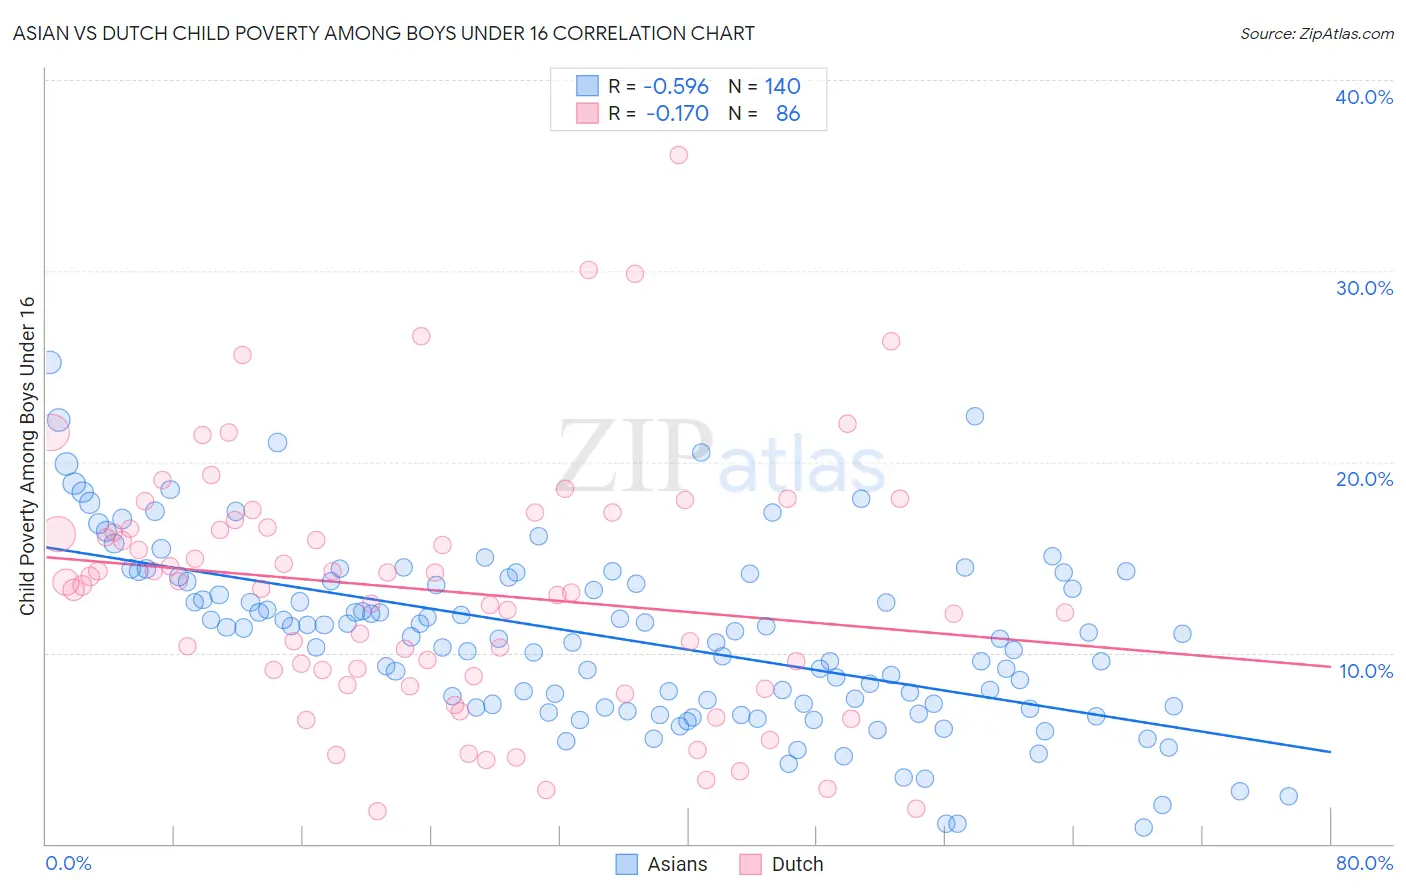
Asian vs Dutch Child Poverty Among Boys Under 16 Correlation Chart
The statistical analysis conducted on geographies consisting of 533,622,634 people shows a substantial negative correlation between the proportion of Asians and poverty level among boys under the age of 16 in the United States with a correlation coefficient (R) of -0.596 and weighted average of 13.5%. Similarly, the statistical analysis conducted on geographies consisting of 535,626,808 people shows a poor negative correlation between the proportion of Dutch and poverty level among boys under the age of 16 in the United States with a correlation coefficient (R) of -0.170 and weighted average of 15.0%, a difference of 11.3%.
Child Poverty Among Boys Under 16 Correlation Summary
| Measurement | Asian | Dutch |
| Minimum | 0.83% | 1.7% |
| Maximum | 25.2% | 36.1% |
| Range | 24.4% | 34.4% |
| Mean | 10.8% | 13.3% |
| Median | 10.9% | 13.4% |
| Interquartile 25% (IQ1) | 7.2% | 8.8% |
| Interquartile 75% (IQ3) | 13.8% | 16.6% |
| Interquartile Range (IQR) | 6.6% | 7.8% |
| Standard Deviation (Sample) | 4.6% | 6.7% |
| Standard Deviation (Population) | 4.6% | 6.6% |
Similar Demographics by Child Poverty Among Boys Under 16
Demographics Similar to Asians by Child Poverty Among Boys Under 16
In terms of child poverty among boys under 16, the demographic groups most similar to Asians are Eastern European (13.5%, a difference of 0.060%), Immigrants from Bolivia (13.5%, a difference of 0.080%), Okinawan (13.5%, a difference of 0.17%), Cypriot (13.6%, a difference of 0.26%), and Immigrants from Lithuania (13.5%, a difference of 0.29%).
| Demographics | Rating | Rank | Child Poverty Among Boys Under 16 |
| Indians (Asian) | 99.9 /100 | #20 | Exceptional 13.3% |
| Immigrants | Eastern Asia | 99.9 /100 | #21 | Exceptional 13.3% |
| Tongans | 99.9 /100 | #22 | Exceptional 13.4% |
| Latvians | 99.9 /100 | #23 | Exceptional 13.4% |
| Immigrants | Lithuania | 99.8 /100 | #24 | Exceptional 13.5% |
| Okinawans | 99.8 /100 | #25 | Exceptional 13.5% |
| Immigrants | Bolivia | 99.8 /100 | #26 | Exceptional 13.5% |
| Asians | 99.8 /100 | #27 | Exceptional 13.5% |
| Eastern Europeans | 99.8 /100 | #28 | Exceptional 13.5% |
| Cypriots | 99.8 /100 | #29 | Exceptional 13.6% |
| Swedes | 99.8 /100 | #30 | Exceptional 13.6% |
| Turks | 99.8 /100 | #31 | Exceptional 13.6% |
| Immigrants | China | 99.8 /100 | #32 | Exceptional 13.6% |
| Danes | 99.8 /100 | #33 | Exceptional 13.6% |
| Assyrians/Chaldeans/Syriacs | 99.8 /100 | #34 | Exceptional 13.6% |
Demographics Similar to Dutch by Child Poverty Among Boys Under 16
In terms of child poverty among boys under 16, the demographic groups most similar to Dutch are Immigrants from Switzerland (15.0%, a difference of 0.010%), Immigrants from Denmark (15.0%, a difference of 0.11%), Serbian (15.1%, a difference of 0.12%), Romanian (15.0%, a difference of 0.15%), and Immigrants from Belarus (15.0%, a difference of 0.22%).
| Demographics | Rating | Rank | Child Poverty Among Boys Under 16 |
| British | 96.2 /100 | #98 | Exceptional 15.0% |
| Immigrants | France | 96.1 /100 | #99 | Exceptional 15.0% |
| Chileans | 95.8 /100 | #100 | Exceptional 15.0% |
| Immigrants | Belarus | 95.7 /100 | #101 | Exceptional 15.0% |
| Romanians | 95.6 /100 | #102 | Exceptional 15.0% |
| Immigrants | Denmark | 95.6 /100 | #103 | Exceptional 15.0% |
| Immigrants | Switzerland | 95.4 /100 | #104 | Exceptional 15.0% |
| Dutch | 95.4 /100 | #105 | Exceptional 15.0% |
| Serbians | 95.2 /100 | #106 | Exceptional 15.1% |
| Jordanians | 95.1 /100 | #107 | Exceptional 15.1% |
| Immigrants | England | 94.8 /100 | #108 | Exceptional 15.1% |
| Pakistanis | 94.7 /100 | #109 | Exceptional 15.1% |
| English | 94.3 /100 | #110 | Exceptional 15.1% |
| Immigrants | Zimbabwe | 94.2 /100 | #111 | Exceptional 15.2% |
| Basques | 93.8 /100 | #112 | Exceptional 15.2% |