Asian vs Panamanian Child Poverty Among Boys Under 16
COMPARE
Asian
Panamanian
Child Poverty Among Boys Under 16
Child Poverty Among Boys Under 16 Comparison
Asians
Panamanians
13.5%
CHILD POVERTY AMONG BOYS UNDER 16
99.8/ 100
METRIC RATING
27th/ 347
METRIC RANK
17.7%
CHILD POVERTY AMONG BOYS UNDER 16
5.9/ 100
METRIC RATING
214th/ 347
METRIC RANK
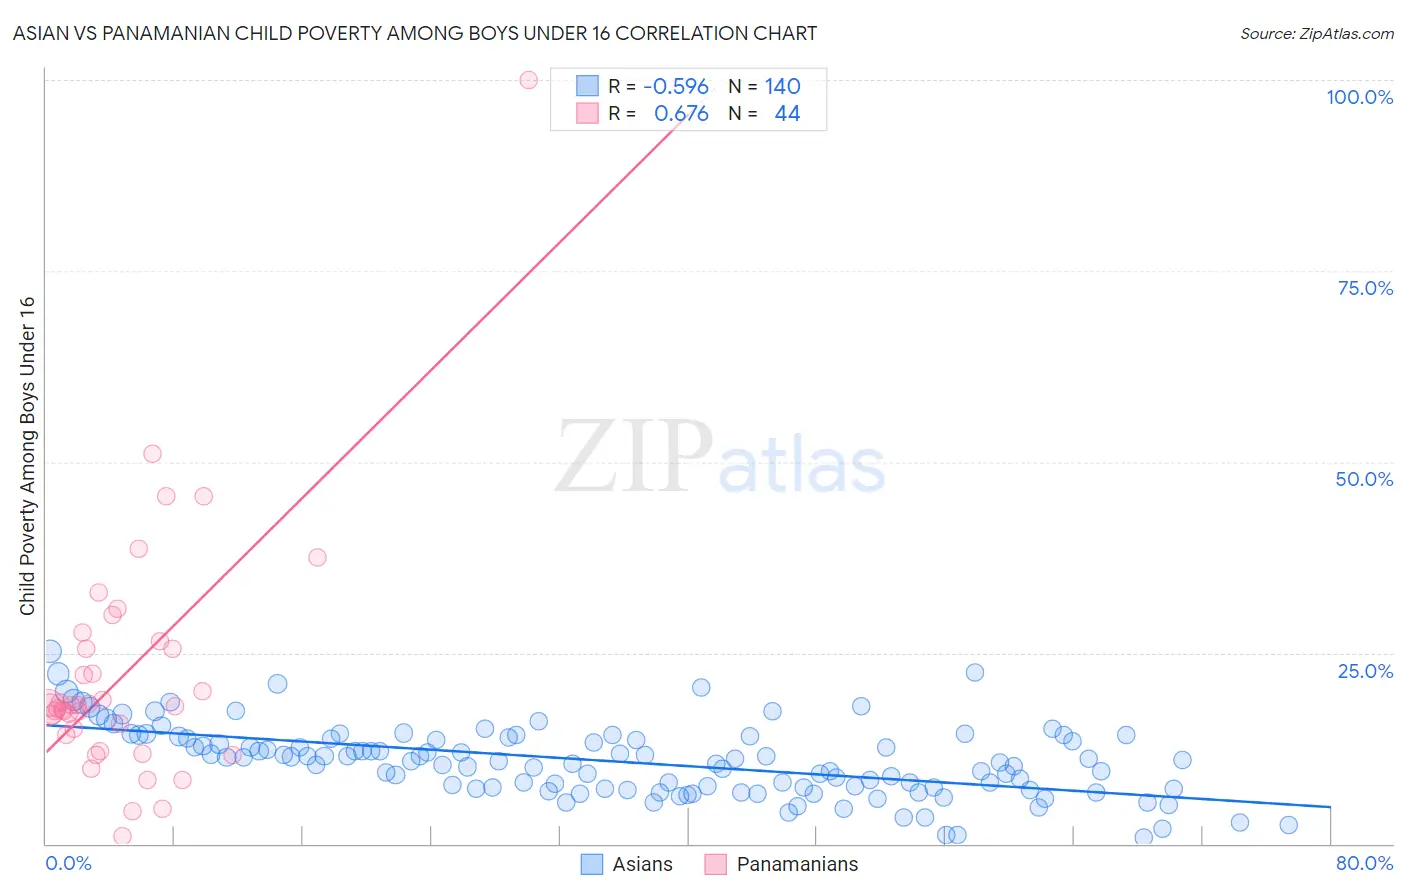
Asian vs Panamanian Child Poverty Among Boys Under 16 Correlation Chart
The statistical analysis conducted on geographies consisting of 533,622,634 people shows a substantial negative correlation between the proportion of Asians and poverty level among boys under the age of 16 in the United States with a correlation coefficient (R) of -0.596 and weighted average of 13.5%. Similarly, the statistical analysis conducted on geographies consisting of 278,864,052 people shows a significant positive correlation between the proportion of Panamanians and poverty level among boys under the age of 16 in the United States with a correlation coefficient (R) of 0.676 and weighted average of 17.7%, a difference of 30.9%.
Child Poverty Among Boys Under 16 Correlation Summary
| Measurement | Asian | Panamanian |
| Minimum | 0.83% | 0.96% |
| Maximum | 25.2% | 100.0% |
| Range | 24.4% | 99.0% |
| Mean | 10.8% | 22.2% |
| Median | 10.9% | 18.1% |
| Interquartile 25% (IQ1) | 7.2% | 14.7% |
| Interquartile 75% (IQ3) | 13.8% | 26.0% |
| Interquartile Range (IQR) | 6.6% | 11.4% |
| Standard Deviation (Sample) | 4.6% | 16.2% |
| Standard Deviation (Population) | 4.6% | 16.0% |
Similar Demographics by Child Poverty Among Boys Under 16
Demographics Similar to Asians by Child Poverty Among Boys Under 16
In terms of child poverty among boys under 16, the demographic groups most similar to Asians are Eastern European (13.5%, a difference of 0.060%), Immigrants from Bolivia (13.5%, a difference of 0.080%), Okinawan (13.5%, a difference of 0.17%), Cypriot (13.6%, a difference of 0.26%), and Immigrants from Lithuania (13.5%, a difference of 0.29%).
| Demographics | Rating | Rank | Child Poverty Among Boys Under 16 |
| Indians (Asian) | 99.9 /100 | #20 | Exceptional 13.3% |
| Immigrants | Eastern Asia | 99.9 /100 | #21 | Exceptional 13.3% |
| Tongans | 99.9 /100 | #22 | Exceptional 13.4% |
| Latvians | 99.9 /100 | #23 | Exceptional 13.4% |
| Immigrants | Lithuania | 99.8 /100 | #24 | Exceptional 13.5% |
| Okinawans | 99.8 /100 | #25 | Exceptional 13.5% |
| Immigrants | Bolivia | 99.8 /100 | #26 | Exceptional 13.5% |
| Asians | 99.8 /100 | #27 | Exceptional 13.5% |
| Eastern Europeans | 99.8 /100 | #28 | Exceptional 13.5% |
| Cypriots | 99.8 /100 | #29 | Exceptional 13.6% |
| Swedes | 99.8 /100 | #30 | Exceptional 13.6% |
| Turks | 99.8 /100 | #31 | Exceptional 13.6% |
| Immigrants | China | 99.8 /100 | #32 | Exceptional 13.6% |
| Danes | 99.8 /100 | #33 | Exceptional 13.6% |
| Assyrians/Chaldeans/Syriacs | 99.8 /100 | #34 | Exceptional 13.6% |
Demographics Similar to Panamanians by Child Poverty Among Boys Under 16
In terms of child poverty among boys under 16, the demographic groups most similar to Panamanians are Immigrants from Eastern Africa (17.7%, a difference of 0.0%), Osage (17.7%, a difference of 0.070%), Moroccan (17.7%, a difference of 0.16%), Japanese (17.7%, a difference of 0.19%), and Iraqi (17.7%, a difference of 0.21%).
| Demographics | Rating | Rank | Child Poverty Among Boys Under 16 |
| Immigrants | Thailand | 8.2 /100 | #207 | Tragic 17.5% |
| Malaysians | 7.6 /100 | #208 | Tragic 17.6% |
| Alaskan Athabascans | 7.3 /100 | #209 | Tragic 17.6% |
| Immigrants | Armenia | 6.8 /100 | #210 | Tragic 17.6% |
| Immigrants | Immigrants | 6.7 /100 | #211 | Tragic 17.6% |
| Aleuts | 6.6 /100 | #212 | Tragic 17.7% |
| Immigrants | Eastern Africa | 6.0 /100 | #213 | Tragic 17.7% |
| Panamanians | 5.9 /100 | #214 | Tragic 17.7% |
| Osage | 5.8 /100 | #215 | Tragic 17.7% |
| Moroccans | 5.6 /100 | #216 | Tragic 17.7% |
| Japanese | 5.5 /100 | #217 | Tragic 17.7% |
| Iraqis | 5.5 /100 | #218 | Tragic 17.7% |
| Sierra Leoneans | 5.3 /100 | #219 | Tragic 17.8% |
| Immigrants | Cambodia | 5.1 /100 | #220 | Tragic 17.8% |
| Immigrants | Panama | 4.3 /100 | #221 | Tragic 17.9% |