Belgian vs Immigrants Child Poverty Under the Age of 5

COMPARE

Belgian
Race
Ancestry
AfghanAfricanAlaska NativeAlaskan AthabascanAlbanianAleutAlsatianAmericanApacheArabArapahoArgentineanArmenianAssyrian/Chaldean/SyriacAustralianAustrianBahamianBangladeshiBarbadianBasqueBelgianBelizeanBermudanBhutaneseBlackfeetBolivianBrazilianBritishBritish West IndianBulgarianBurmeseCajunCambodianCanadianCape VerdeanCarpatho RusynCelticCentral AmericanCentral American IndianCherokeeCheyenneChickasawChileanChineseChippewaChoctawColombianColvilleComancheCosta RicanCreeCreekCroatianCrowCubanCypriotCzechCzechoslovakianDanishDelawareDominicanDutchDutch West IndianEastern EuropeanEcuadorianEgyptianEnglishEstonianEthiopianEuropeanFijianFilipinoFinnishFrenchFrench American IndianFrench CanadianGermanGerman RussianGhanaianGreekGuamanian/ChamorroGuatemalanGuyaneseHaitianHmongHonduranHopiHoumaHungarianIcelanderIndian (Asian)IndonesianInupiatIranianIraqiIrishIroquoisIsraeliItalianJamaicanJapaneseJordanianKenyanKiowaKoreanLaotianLatvianLebaneseLiberianLithuanianLumbeeLuxembourgerMacedonianMalaysianMalteseMarshalleseMenomineeMexicanMexican American IndianMongolianMoroccanNative HawaiianNavajoNepaleseNew ZealanderNicaraguanNigerianNorthern EuropeanNorwegianOkinawanOsageOttawaPaiutePakistaniPalestinianPanamanianParaguayanPennsylvania GermanPeruvianPimaPolishPortuguesePotawatomiPuebloPuerto RicanPuget Sound SalishRomanianRussianSalvadoranSamoanScandinavianScotch-IrishScottishSeminoleSenegaleseSerbianShoshoneSierra LeoneanSiouxSlavicSlovakSloveneSomaliSouth AfricanSouth AmericanSouth American IndianSoviet UnionSpaniardSpanishSpanish AmericanSpanish American IndianSri LankanSubsaharan AfricanSudaneseSwedishSwissSyrianTaiwaneseThaiTlingit-HaidaTohono O'OdhamTonganTrinidadian and TobagonianTsimshianTurkishU.S. Virgin IslanderUgandanUkrainianUruguayanUteVenezuelanVietnameseWelshWest IndianYakamaYaquiYugoslavianYumanYup'ikZimbabwean
Immigration
NonimmigrantsAfghanistanAfricaAlbaniaArgentinaArmeniaAsiaAustraliaAustriaBahamasBangladeshBarbadosBelarusBelgiumBelizeBoliviaBosnia and HerzegovinaBrazilBulgariaBurma/MyanmarCabo VerdeCambodiaCameroonCanadaCaribbeanCentral AmericaChileChinaColombiaCongoCosta RicaCroatiaCubaCzechoslovakiaDenmarkDominicaDominican RepublicEastern AfricaEastern AsiaEastern EuropeEcuadorEgyptEl SalvadorEnglandEritreaEthiopiaEuropeFijiFranceGermanyGhanaGreeceGrenadaGuatemalaGuyanaHaitiHondurasHong KongHungaryIndiaIndonesiaIranIraqIrelandIsraelItalyJamaicaJapanJordanKazakhstanKenyaKoreaKuwaitLaosLatin AmericaLatviaLebanonLiberiaLithuaniaMalaysiaMexicoMicronesiaMiddle AfricaMoldovaMoroccoNepalNetherlandsNicaraguaNigeriaNorth AmericaNorth MacedoniaNorthern AfricaNorthern EuropeNorwayOceaniaPakistanPanamaPeruPhilippinesPolandPortugalRomaniaRussiaSaudi ArabiaScotlandSenegalSerbiaSierra LeoneSingaporeSomaliaSouth AfricaSouth AmericaSouth Central AsiaSouth Eastern AsiaSouthern EuropeSpainSri LankaSt. Vincent and the GrenadinesSudanSwedenSwitzerlandSyriaTaiwanThailandTrinidad and TobagoTurkeyUgandaUkraineUruguayUzbekistanVenezuelaVietnamWest IndiesWestern AfricaWestern AsiaWestern EuropeYemenZaireZimbabweAzores
Immigrants
Race
Ancestry
AfghanAfricanAlaska NativeAlaskan AthabascanAlbanianAleutAlsatianAmericanApacheArabArapahoArgentineanArmenianAssyrian/Chaldean/SyriacAustralianAustrianBahamianBangladeshiBarbadianBasqueBelizeanBermudanBhutaneseBlackfeetBolivianBrazilianBritishBritish West IndianBulgarianBurmeseCajunCambodianCanadianCape VerdeanCarpatho RusynCelticCentral AmericanCentral American IndianCherokeeCheyenneChickasawChileanChineseChippewaChoctawColombianColvilleComancheCosta RicanCreeCreekCroatianCrowCubanCypriotCzechCzechoslovakianDanishDelawareDominicanDutchDutch West IndianEastern EuropeanEcuadorianEgyptianEnglishEstonianEthiopianEuropeanFijianFilipinoFinnishFrenchFrench American IndianFrench CanadianGermanGerman RussianGhanaianGreekGuamanian/ChamorroGuatemalanGuyaneseHaitianHmongHonduranHopiHoumaHungarianIcelanderIndian (Asian)IndonesianInupiatIranianIraqiIrishIroquoisIsraeliItalianJamaicanJapaneseJordanianKenyanKiowaKoreanLaotianLatvianLebaneseLiberianLithuanianLumbeeLuxembourgerMacedonianMalaysianMalteseMarshalleseMenomineeMexicanMexican American IndianMongolianMoroccanNative HawaiianNavajoNepaleseNew ZealanderNicaraguanNigerianNorthern EuropeanNorwegianOkinawanOsageOttawaPaiutePakistaniPalestinianPanamanianParaguayanPennsylvania GermanPeruvianPimaPolishPortuguesePotawatomiPuebloPuerto RicanPuget Sound SalishRomanianRussianSalvadoranSamoanScandinavianScotch-IrishScottishSeminoleSenegaleseSerbianShoshoneSierra LeoneanSiouxSlavicSlovakSloveneSomaliSouth AfricanSouth AmericanSouth American IndianSoviet UnionSpaniardSpanishSpanish AmericanSpanish American IndianSri LankanSubsaharan AfricanSudaneseSwedishSwissSyrianTaiwaneseThaiTlingit-HaidaTohono O'OdhamTonganTrinidadian and TobagonianTsimshianTurkishU.S. Virgin IslanderUgandanUkrainianUruguayanUteVenezuelanVietnameseWelshWest IndianYakamaYaquiYugoslavianYumanYup'ikZimbabwean
Immigration
NonimmigrantsImmigrantsAfghanistanAfricaAlbaniaArgentinaArmeniaAsiaAustraliaAustriaBahamasBangladeshBarbadosBelarusBelgiumBelizeBoliviaBosnia and HerzegovinaBrazilBulgariaBurma/MyanmarCabo VerdeCambodiaCameroonCanadaCaribbeanCentral AmericaChileChinaColombiaCongoCosta RicaCroatiaCubaCzechoslovakiaDenmarkDominicaDominican RepublicEastern AfricaEastern AsiaEastern EuropeEcuadorEgyptEl SalvadorEnglandEritreaEthiopiaEuropeFijiFranceGermanyGhanaGreeceGrenadaGuatemalaGuyanaHaitiHondurasHong KongHungaryIndiaIndonesiaIranIraqIrelandIsraelItalyJamaicaJapanJordanKazakhstanKenyaKoreaKuwaitLaosLatin AmericaLatviaLebanonLiberiaLithuaniaMalaysiaMexicoMicronesiaMiddle AfricaMoldovaMoroccoNepalNetherlandsNicaraguaNigeriaNorth AmericaNorth MacedoniaNorthern AfricaNorthern EuropeNorwayOceaniaPakistanPanamaPeruPhilippinesPolandPortugalRomaniaRussiaSaudi ArabiaScotlandSenegalSerbiaSierra LeoneSingaporeSomaliaSouth AfricaSouth AmericaSouth Central AsiaSouth Eastern AsiaSouthern EuropeSpainSri LankaSt. Vincent and the GrenadinesSudanSwedenSwitzerlandSyriaTaiwanThailandTrinidad and TobagoTurkeyUgandaUkraineUruguayUzbekistanVenezuelaVietnamWest IndiesWestern AfricaWestern AsiaWestern EuropeYemenZaireZimbabweAzores
Child Poverty Under the Age of 5
Income
Poverty
Unemployment
Labor Participation
Family Structure
Vehicle Availability
Education Level
Disability

Child Poverty Under the Age of 5 Comparison

Belgians

Immigrants

Good
Tragic
16.7%
CHILD POVERTY UNDER THE AGE OF 5
77.2/ 100
METRIC RATING
152nd/ 347
METRIC RANK
18.2%
CHILD POVERTY UNDER THE AGE OF 5
9.9/ 100
METRIC RATING
207th/ 347
METRIC RANK

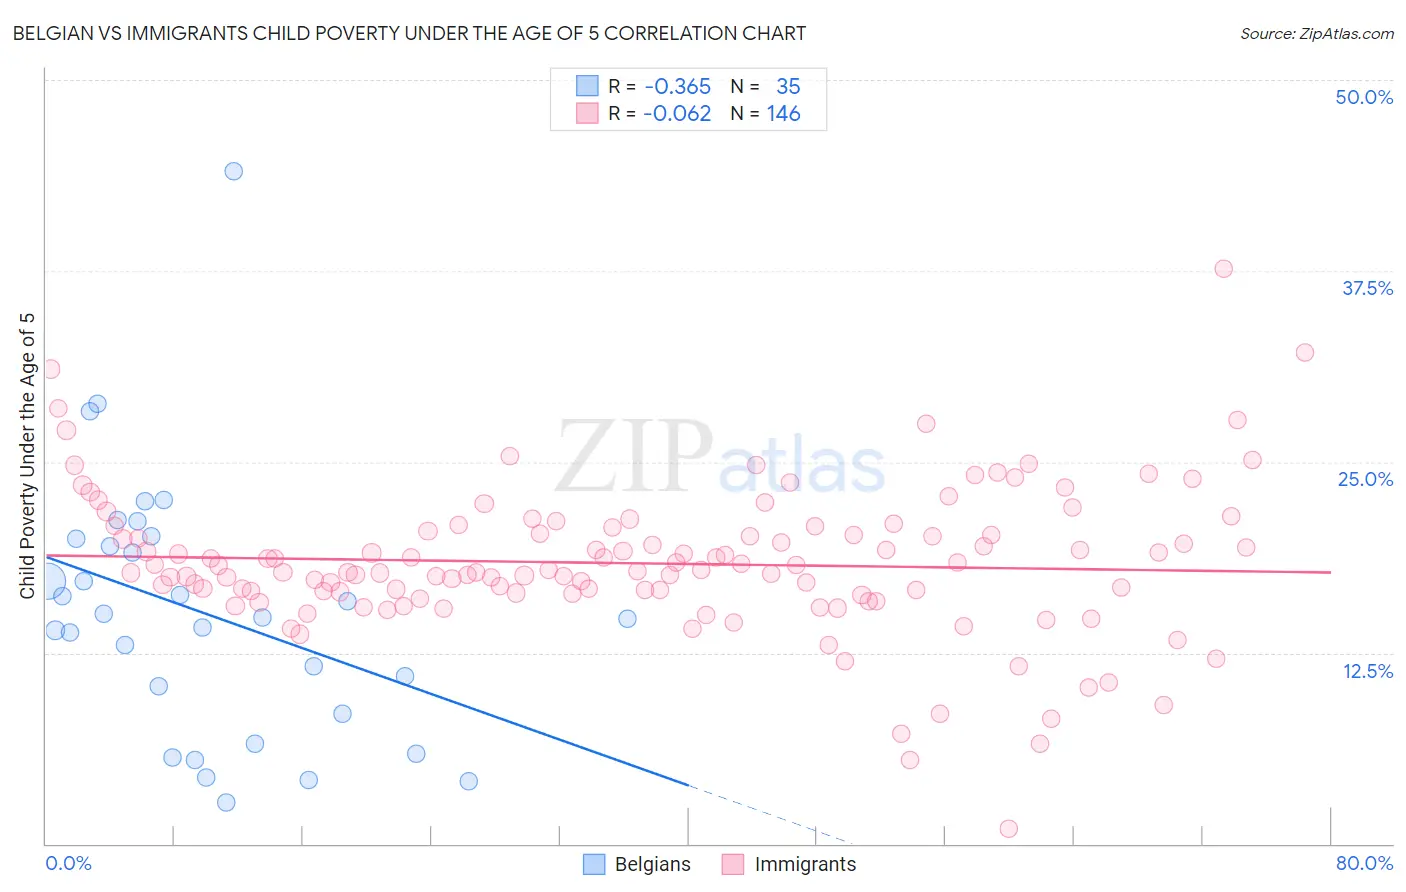
Belgian vs Immigrants Child Poverty Under the Age of 5 Correlation Chart

The statistical analysis conducted on geographies consisting of 339,700,992 people shows a mild negative correlation between the proportion of Belgians and poverty level among children under the age of 5 in the United States with a correlation coefficient (R) of -0.365 and weighted average of 16.7%. Similarly, the statistical analysis conducted on geographies consisting of 536,381,100 people shows a slight negative correlation between the proportion of Immigrants and poverty level among children under the age of 5 in the United States with a correlation coefficient (R) of -0.062 and weighted average of 18.2%, a difference of 9.2%.
Belgian vs Immigrants Child Poverty Under the Age of 5

Child Poverty Under the Age of 5 Correlation Summary

MeasurementBelgianImmigrants
Minimum2.7%1.0%
Maximum44.0%37.7%
Range41.3%36.6%
Mean15.1%18.4%
Median14.9%17.9%
Interquartile 25% (IQ1)8.5%16.4%
Interquartile 75% (IQ3)20.0%20.5%
Interquartile Range (IQR)11.5%4.1%
Standard Deviation (Sample)8.5%4.8%
Standard Deviation (Population)8.3%4.8%

Similar Demographics by Child Poverty Under the Age of 5

Demographics Similar to Belgians by Child Poverty Under the Age of 5

In terms of child poverty under the age of 5, the demographic groups most similar to Belgians are Dutch (16.7%, a difference of 0.020%), Canadian (16.7%, a difference of 0.060%), Colombian (16.7%, a difference of 0.10%), Immigrants from Venezuela (16.7%, a difference of 0.18%), and New Zealander (16.6%, a difference of 0.24%).
DemographicsRating | RankChild Poverty Under the Age of 5
Immigrants | Ethiopia
82.1
/100
|
#145
Excellent
16.6%
Israelis
82.0
/100
|
#146
Excellent
16.6%
Immigrants | Nepal
80.3
/100
|
#147
Excellent
16.6%
Syrians
79.1
/100
|
#148
Good
16.6%
New Zealanders
78.7
/100
|
#149
Good
16.6%
Colombians
77.8
/100
|
#150
Good
16.7%
Canadians
77.6
/100
|
#151
Good
16.7%
Belgians
77.2
/100
|
#152
Good
16.7%
Dutch
77.1
/100
|
#153
Good
16.7%
Immigrants | Venezuela
76.0
/100
|
#154
Good
16.7%
South Americans
75.1
/100
|
#155
Good
16.7%
Afghans
74.4
/100
|
#156
Good
16.8%
Venezuelans
73.7
/100
|
#157
Good
16.8%
Czechoslovakians
72.5
/100
|
#158
Good
16.8%
Immigrants | Syria
72.3
/100
|
#159
Good
16.8%

Demographics Similar to Immigrants by Child Poverty Under the Age of 5

In terms of child poverty under the age of 5, the demographic groups most similar to Immigrants are Scotch-Irish (18.2%, a difference of 0.020%), Spanish (18.2%, a difference of 0.020%), Panamanian (18.2%, a difference of 0.030%), Moroccan (18.2%, a difference of 0.12%), and Nepalese (18.3%, a difference of 0.33%).
DemographicsRating | RankChild Poverty Under the Age of 5
Iraqis
14.0
/100
|
#200
Poor
18.0%
Ugandans
13.9
/100
|
#201
Poor
18.0%
Japanese
13.8
/100
|
#202
Poor
18.1%
Immigrants | Cambodia
13.7
/100
|
#203
Poor
18.1%
Immigrants | Eastern Africa
13.4
/100
|
#204
Poor
18.1%
Spaniards
12.8
/100
|
#205
Poor
18.1%
Whites/Caucasians
12.6
/100
|
#206
Poor
18.1%
Immigrants | Immigrants
9.9
/100
|
#207
Tragic
18.2%
Scotch-Irish
9.8
/100
|
#208
Tragic
18.2%
Spanish
9.8
/100
|
#209
Tragic
18.2%
Panamanians
9.7
/100
|
#210
Tragic
18.2%
Moroccans
9.4
/100
|
#211
Tragic
18.2%
Nepalese
8.7
/100
|
#212
Tragic
18.3%
Immigrants | Thailand
8.6
/100
|
#213
Tragic
18.3%
Malaysians
6.5
/100
|
#214
Tragic
18.4%