Immigrants from Switzerland vs Immigrants from Caribbean Seniors Poverty Over the Age of 65

COMPARE

Immigrants from Switzerland
Race
Ancestry
AfghanAfricanAlaska NativeAlaskan AthabascanAlbanianAleutAlsatianAmericanApacheArabArapahoArgentineanArmenianAssyrian/Chaldean/SyriacAustralianAustrianBahamianBangladeshiBarbadianBasqueBelgianBelizeanBermudanBhutaneseBlackfeetBolivianBrazilianBritishBritish West IndianBulgarianBurmeseCajunCambodianCanadianCape VerdeanCarpatho RusynCelticCentral AmericanCentral American IndianCherokeeCheyenneChickasawChileanChineseChippewaChoctawColombianColvilleComancheCosta RicanCreeCreekCroatianCrowCubanCypriotCzechCzechoslovakianDanishDelawareDominicanDutchDutch West IndianEastern EuropeanEcuadorianEgyptianEnglishEstonianEthiopianEuropeanFijianFilipinoFinnishFrenchFrench American IndianFrench CanadianGermanGerman RussianGhanaianGreekGuamanian/ChamorroGuatemalanGuyaneseHaitianHmongHonduranHopiHoumaHungarianIcelanderIndian (Asian)IndonesianInupiatIranianIraqiIrishIroquoisIsraeliItalianJamaicanJapaneseJordanianKenyanKiowaKoreanLaotianLatvianLebaneseLiberianLithuanianLumbeeLuxembourgerMacedonianMalaysianMalteseMarshalleseMenomineeMexicanMexican American IndianMongolianMoroccanNative HawaiianNavajoNepaleseNew ZealanderNicaraguanNigerianNorthern EuropeanNorwegianOkinawanOsageOttawaPaiutePakistaniPalestinianPanamanianParaguayanPennsylvania GermanPeruvianPimaPolishPortuguesePotawatomiPuebloPuerto RicanPuget Sound SalishRomanianRussianSalvadoranSamoanScandinavianScotch-IrishScottishSeminoleSenegaleseSerbianShoshoneSierra LeoneanSiouxSlavicSlovakSloveneSomaliSouth AfricanSouth AmericanSouth American IndianSoviet UnionSpaniardSpanishSpanish AmericanSpanish American IndianSri LankanSubsaharan AfricanSudaneseSwedishSwissSyrianTaiwaneseThaiTlingit-HaidaTohono O'OdhamTonganTrinidadian and TobagonianTsimshianTurkishU.S. Virgin IslanderUgandanUkrainianUruguayanUteVenezuelanVietnameseWelshWest IndianYakamaYaquiYugoslavianYumanYup'ikZimbabwean
Immigration
NonimmigrantsImmigrantsAfghanistanAfricaAlbaniaArgentinaArmeniaAsiaAustraliaAustriaBahamasBangladeshBarbadosBelarusBelgiumBelizeBoliviaBosnia and HerzegovinaBrazilBulgariaBurma/MyanmarCabo VerdeCambodiaCameroonCanadaCentral AmericaChileChinaColombiaCongoCosta RicaCroatiaCubaCzechoslovakiaDenmarkDominicaDominican RepublicEastern AfricaEastern AsiaEastern EuropeEcuadorEgyptEl SalvadorEnglandEritreaEthiopiaEuropeFijiFranceGermanyGhanaGreeceGrenadaGuatemalaGuyanaHaitiHondurasHong KongHungaryIndiaIndonesiaIranIraqIrelandIsraelItalyJamaicaJapanJordanKazakhstanKenyaKoreaKuwaitLaosLatin AmericaLatviaLebanonLiberiaLithuaniaMalaysiaMexicoMicronesiaMiddle AfricaMoldovaMoroccoNepalNetherlandsNicaraguaNigeriaNorth AmericaNorth MacedoniaNorthern AfricaNorthern EuropeNorwayOceaniaPakistanPanamaPeruPhilippinesPolandPortugalRomaniaRussiaSaudi ArabiaScotlandSenegalSerbiaSierra LeoneSingaporeSomaliaSouth AfricaSouth AmericaSouth Central AsiaSouth Eastern AsiaSouthern EuropeSpainSri LankaSt. Vincent and the GrenadinesSudanSwedenSwitzerlandSyriaTaiwanThailandTrinidad and TobagoTurkeyUgandaUkraineUruguayUzbekistanVenezuelaVietnamWest IndiesWestern AfricaWestern AsiaWestern EuropeYemenZaireZimbabweAzores
Immigrants from Caribbean
Race
Ancestry
AfghanAfricanAlaska NativeAlaskan AthabascanAlbanianAleutAlsatianAmericanApacheArabArapahoArgentineanArmenianAssyrian/Chaldean/SyriacAustralianAustrianBahamianBangladeshiBarbadianBasqueBelgianBelizeanBermudanBhutaneseBlackfeetBolivianBrazilianBritishBritish West IndianBulgarianBurmeseCajunCambodianCanadianCape VerdeanCarpatho RusynCelticCentral AmericanCentral American IndianCherokeeCheyenneChickasawChileanChineseChippewaChoctawColombianColvilleComancheCosta RicanCreeCreekCroatianCrowCubanCypriotCzechCzechoslovakianDanishDelawareDominicanDutchDutch West IndianEastern EuropeanEcuadorianEgyptianEnglishEstonianEthiopianEuropeanFijianFilipinoFinnishFrenchFrench American IndianFrench CanadianGermanGerman RussianGhanaianGreekGuamanian/ChamorroGuatemalanGuyaneseHaitianHmongHonduranHopiHoumaHungarianIcelanderIndian (Asian)IndonesianInupiatIranianIraqiIrishIroquoisIsraeliItalianJamaicanJapaneseJordanianKenyanKiowaKoreanLaotianLatvianLebaneseLiberianLithuanianLumbeeLuxembourgerMacedonianMalaysianMalteseMarshalleseMenomineeMexicanMexican American IndianMongolianMoroccanNative HawaiianNavajoNepaleseNew ZealanderNicaraguanNigerianNorthern EuropeanNorwegianOkinawanOsageOttawaPaiutePakistaniPalestinianPanamanianParaguayanPennsylvania GermanPeruvianPimaPolishPortuguesePotawatomiPuebloPuerto RicanPuget Sound SalishRomanianRussianSalvadoranSamoanScandinavianScotch-IrishScottishSeminoleSenegaleseSerbianShoshoneSierra LeoneanSiouxSlavicSlovakSloveneSomaliSouth AfricanSouth AmericanSouth American IndianSoviet UnionSpaniardSpanishSpanish AmericanSpanish American IndianSri LankanSubsaharan AfricanSudaneseSwedishSwissSyrianTaiwaneseThaiTlingit-HaidaTohono O'OdhamTonganTrinidadian and TobagonianTsimshianTurkishU.S. Virgin IslanderUgandanUkrainianUruguayanUteVenezuelanVietnameseWelshWest IndianYakamaYaquiYugoslavianYumanYup'ikZimbabwean
Immigration
NonimmigrantsImmigrantsAfghanistanAfricaAlbaniaArgentinaArmeniaAsiaAustraliaAustriaBahamasBangladeshBarbadosBelarusBelgiumBelizeBoliviaBosnia and HerzegovinaBrazilBulgariaBurma/MyanmarCabo VerdeCambodiaCameroonCanadaCaribbeanCentral AmericaChileChinaColombiaCongoCosta RicaCroatiaCubaCzechoslovakiaDenmarkDominicaDominican RepublicEastern AfricaEastern AsiaEastern EuropeEcuadorEgyptEl SalvadorEnglandEritreaEthiopiaEuropeFijiFranceGermanyGhanaGreeceGrenadaGuatemalaGuyanaHaitiHondurasHong KongHungaryIndiaIndonesiaIranIraqIrelandIsraelItalyJamaicaJapanJordanKazakhstanKenyaKoreaKuwaitLaosLatin AmericaLatviaLebanonLiberiaLithuaniaMalaysiaMexicoMicronesiaMiddle AfricaMoldovaMoroccoNepalNetherlandsNicaraguaNigeriaNorth AmericaNorth MacedoniaNorthern AfricaNorthern EuropeNorwayOceaniaPakistanPanamaPeruPhilippinesPolandPortugalRomaniaRussiaSaudi ArabiaScotlandSenegalSerbiaSierra LeoneSingaporeSomaliaSouth AfricaSouth AmericaSouth Central AsiaSouth Eastern AsiaSouthern EuropeSpainSri LankaSt. Vincent and the GrenadinesSudanSwedenSyriaTaiwanThailandTrinidad and TobagoTurkeyUgandaUkraineUruguayUzbekistanVenezuelaVietnamWest IndiesWestern AfricaWestern AsiaWestern EuropeYemenZaireZimbabweAzores
Seniors Poverty Over the Age of 65
Income
Poverty
Unemployment
Labor Participation
Family Structure
Vehicle Availability
Education Level
Disability

Seniors Poverty Over the Age of 65 Comparison

Immigrants from Switzerland

Immigrants from Caribbean

Good
Tragic
10.6%
SENIORS POVERTY OVER THE AGE OF 65
77.3/ 100
METRIC RATING
150th/ 347
METRIC RANK
16.5%
SENIORS POVERTY OVER THE AGE OF 65
0.0/ 100
METRIC RATING
337th/ 347
METRIC RANK

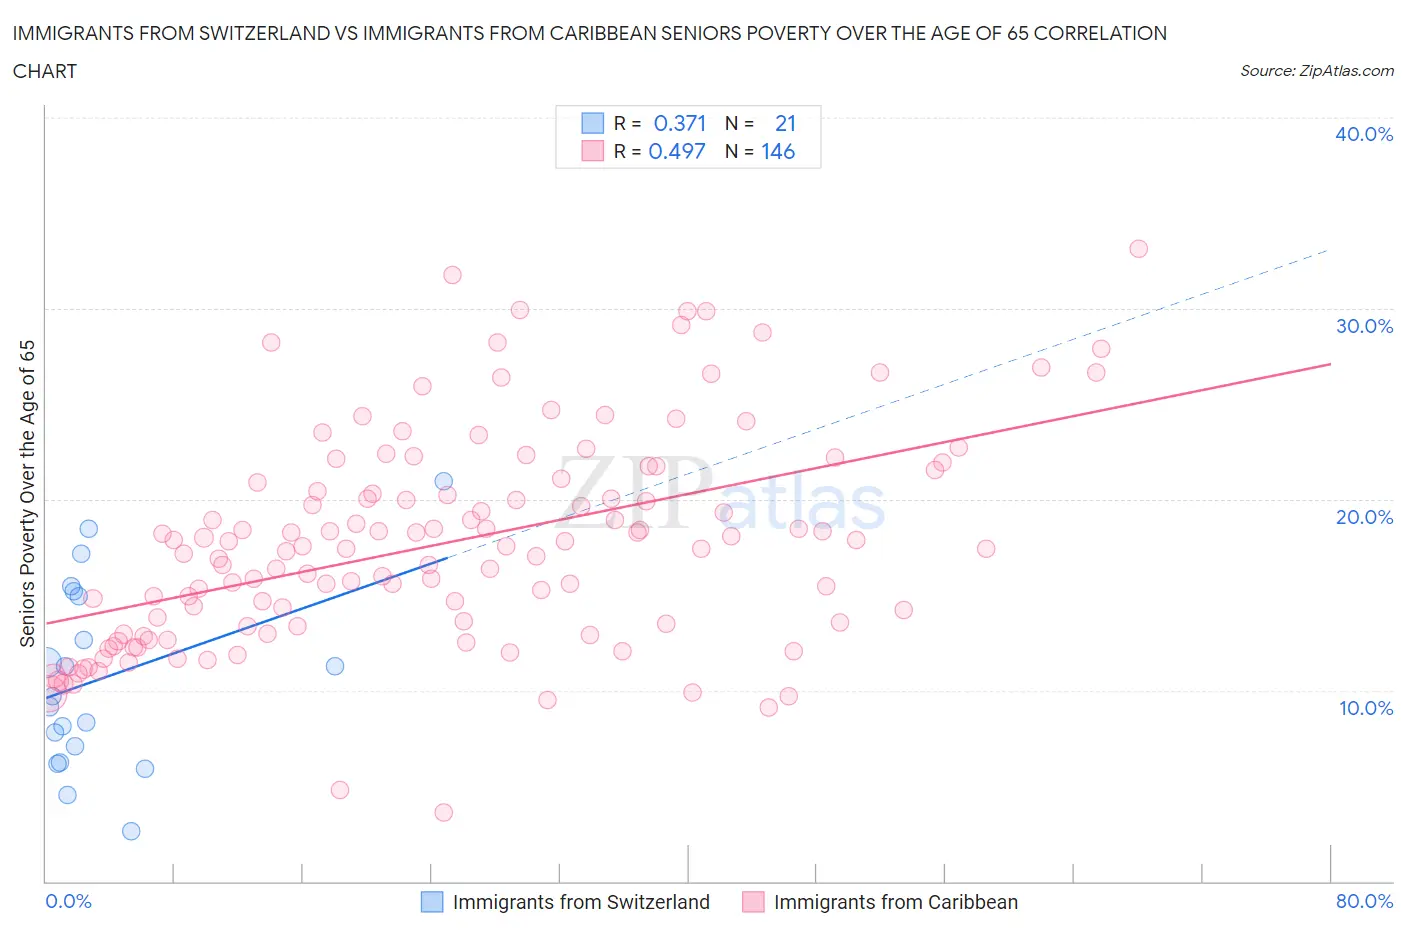
Immigrants from Switzerland vs Immigrants from Caribbean Seniors Poverty Over the Age of 65 Correlation Chart

The statistical analysis conducted on geographies consisting of 147,923,898 people shows a mild positive correlation between the proportion of Immigrants from Switzerland and poverty level among seniors over the age of 65 in the United States with a correlation coefficient (R) of 0.371 and weighted average of 10.6%. Similarly, the statistical analysis conducted on geographies consisting of 447,867,383 people shows a moderate positive correlation between the proportion of Immigrants from Caribbean and poverty level among seniors over the age of 65 in the United States with a correlation coefficient (R) of 0.497 and weighted average of 16.5%, a difference of 55.1%.
Immigrants from Switzerland vs Immigrants from Caribbean Seniors Poverty Over the Age of 65

Seniors Poverty Over the Age of 65 Correlation Summary

MeasurementImmigrants from SwitzerlandImmigrants from Caribbean
Minimum2.6%3.6%
Maximum20.9%33.2%
Range18.3%29.5%
Mean10.7%17.7%
Median9.7%17.5%
Interquartile 25% (IQ1)6.6%13.4%
Interquartile 75% (IQ3)15.1%20.9%
Interquartile Range (IQR)8.4%7.5%
Standard Deviation (Sample)4.9%5.6%
Standard Deviation (Population)4.8%5.6%

Similar Demographics by Seniors Poverty Over the Age of 65

Demographics Similar to Immigrants from Switzerland by Seniors Poverty Over the Age of 65

In terms of seniors poverty over the age of 65, the demographic groups most similar to Immigrants from Switzerland are Spanish (10.6%, a difference of 0.060%), American (10.6%, a difference of 0.10%), Immigrants from Cameroon (10.6%, a difference of 0.10%), Immigrants from Egypt (10.6%, a difference of 0.10%), and Fijian (10.7%, a difference of 0.22%).
DemographicsRating | RankSeniors Poverty Over the Age of 65
Immigrants | Asia
80.8
/100
|
#143
Excellent
10.6%
Iraqis
80.7
/100
|
#144
Excellent
10.6%
Laotians
79.9
/100
|
#145
Good
10.6%
Alaskan Athabascans
79.1
/100
|
#146
Good
10.6%
Immigrants | Greece
79.0
/100
|
#147
Good
10.6%
Americans
78.1
/100
|
#148
Good
10.6%
Immigrants | Cameroon
78.1
/100
|
#149
Good
10.6%
Immigrants | Switzerland
77.3
/100
|
#150
Good
10.6%
Spanish
76.8
/100
|
#151
Good
10.6%
Immigrants | Egypt
76.5
/100
|
#152
Good
10.6%
Fijians
75.6
/100
|
#153
Good
10.7%
Immigrants | Saudi Arabia
74.9
/100
|
#154
Good
10.7%
Chickasaw
73.6
/100
|
#155
Good
10.7%
Ethiopians
72.9
/100
|
#156
Good
10.7%
Immigrants | Ethiopia
72.9
/100
|
#157
Good
10.7%

Demographics Similar to Immigrants from Caribbean by Seniors Poverty Over the Age of 65

In terms of seniors poverty over the age of 65, the demographic groups most similar to Immigrants from Caribbean are Immigrants from Cabo Verde (16.2%, a difference of 1.8%), Cuban (16.1%, a difference of 2.4%), Immigrants from Nicaragua (15.9%, a difference of 3.7%), Immigrants from Yemen (15.9%, a difference of 3.9%), and Pueblo (17.2%, a difference of 4.2%).
DemographicsRating | RankSeniors Poverty Over the Age of 65
Immigrants | St. Vincent and the Grenadines
0.0
/100
|
#330
Tragic
15.5%
British West Indians
0.0
/100
|
#331
Tragic
15.6%
Immigrants | Grenada
0.0
/100
|
#332
Tragic
15.8%
Immigrants | Yemen
0.0
/100
|
#333
Tragic
15.9%
Immigrants | Nicaragua
0.0
/100
|
#334
Tragic
15.9%
Cubans
0.0
/100
|
#335
Tragic
16.1%
Immigrants | Cabo Verde
0.0
/100
|
#336
Tragic
16.2%
Immigrants | Caribbean
0.0
/100
|
#337
Tragic
16.5%
Pueblo
0.0
/100
|
#338
Tragic
17.2%
Navajo
0.0
/100
|
#339
Tragic
17.5%
Hopi
0.0
/100
|
#340
Tragic
17.8%
Dominicans
0.0
/100
|
#341
Tragic
17.8%
Immigrants | Cuba
0.0
/100
|
#342
Tragic
17.9%
Lumbee
0.0
/100
|
#343
Tragic
18.1%
Immigrants | Dominican Republic
0.0
/100
|
#344
Tragic
18.3%