Arapaho vs Immigrants from Cabo Verde Female Poverty Among 18-24 Year Olds
COMPARE
Arapaho
Immigrants from Cabo Verde
Female Poverty Among 18-24 Year Olds
Female Poverty Among 18-24 Year Olds Comparison
Arapaho
Immigrants from Cabo Verde
25.2%
FEMALE POVERTY AMONG 18-24 YEAR OLDS
0.0/ 100
METRIC RATING
323rd/ 347
METRIC RANK
19.0%
FEMALE POVERTY AMONG 18-24 YEAR OLDS
99.0/ 100
METRIC RATING
89th/ 347
METRIC RANK
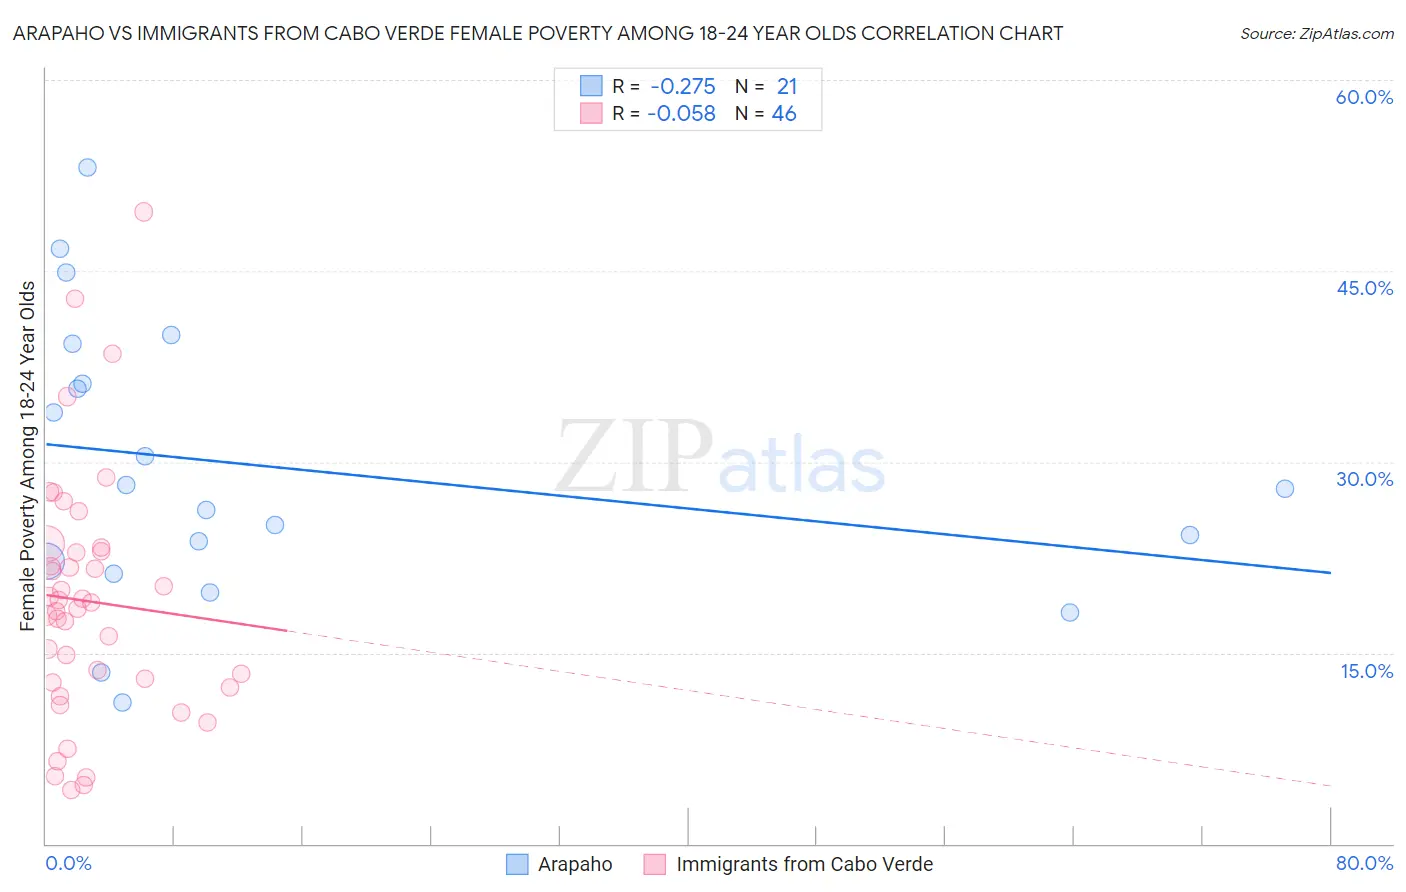
Arapaho vs Immigrants from Cabo Verde Female Poverty Among 18-24 Year Olds Correlation Chart
The statistical analysis conducted on geographies consisting of 29,593,135 people shows a weak negative correlation between the proportion of Arapaho and poverty level among females between the ages 18 and 24 in the United States with a correlation coefficient (R) of -0.275 and weighted average of 25.2%. Similarly, the statistical analysis conducted on geographies consisting of 37,707,106 people shows a slight negative correlation between the proportion of Immigrants from Cabo Verde and poverty level among females between the ages 18 and 24 in the United States with a correlation coefficient (R) of -0.058 and weighted average of 19.0%, a difference of 32.7%.
Female Poverty Among 18-24 Year Olds Correlation Summary
| Measurement | Arapaho | Immigrants from Cabo Verde |
| Minimum | 11.1% | 4.2% |
| Maximum | 53.1% | 49.6% |
| Range | 42.0% | 45.4% |
| Mean | 29.6% | 19.0% |
| Median | 27.8% | 18.7% |
| Interquartile 25% (IQ1) | 21.7% | 12.7% |
| Interquartile 75% (IQ3) | 37.7% | 23.0% |
| Interquartile Range (IQR) | 16.0% | 10.3% |
| Standard Deviation (Sample) | 11.0% | 9.7% |
| Standard Deviation (Population) | 10.8% | 9.6% |
Similar Demographics by Female Poverty Among 18-24 Year Olds
Demographics Similar to Arapaho by Female Poverty Among 18-24 Year Olds
In terms of female poverty among 18-24 year olds, the demographic groups most similar to Arapaho are German Russian (25.2%, a difference of 0.030%), Somali (25.1%, a difference of 0.070%), Immigrants from Zaire (25.1%, a difference of 0.37%), Immigrants from Saudi Arabia (25.3%, a difference of 0.46%), and Yakama (25.3%, a difference of 0.71%).
| Demographics | Rating | Rank | Female Poverty Among 18-24 Year Olds |
| Alsatians | 0.0 /100 | #316 | Tragic 24.4% |
| Osage | 0.0 /100 | #317 | Tragic 24.5% |
| Chickasaw | 0.0 /100 | #318 | Tragic 24.5% |
| Dutch West Indians | 0.0 /100 | #319 | Tragic 24.5% |
| Immigrants | Congo | 0.0 /100 | #320 | Tragic 24.6% |
| Immigrants | Zaire | 0.0 /100 | #321 | Tragic 25.1% |
| Somalis | 0.0 /100 | #322 | Tragic 25.1% |
| Arapaho | 0.0 /100 | #323 | Tragic 25.2% |
| German Russians | 0.0 /100 | #324 | Tragic 25.2% |
| Immigrants | Saudi Arabia | 0.0 /100 | #325 | Tragic 25.3% |
| Yakama | 0.0 /100 | #326 | Tragic 25.3% |
| Ute | 0.0 /100 | #327 | Tragic 25.4% |
| Natives/Alaskans | 0.0 /100 | #328 | Tragic 25.4% |
| Cajuns | 0.0 /100 | #329 | Tragic 25.7% |
| Immigrants | Somalia | 0.0 /100 | #330 | Tragic 25.7% |
Demographics Similar to Immigrants from Cabo Verde by Female Poverty Among 18-24 Year Olds
In terms of female poverty among 18-24 year olds, the demographic groups most similar to Immigrants from Cabo Verde are Croatian (19.0%, a difference of 0.020%), Afghan (19.0%, a difference of 0.030%), Romanian (19.0%, a difference of 0.12%), Immigrants from Jamaica (18.9%, a difference of 0.17%), and Filipino (19.0%, a difference of 0.17%).
| Demographics | Rating | Rank | Female Poverty Among 18-24 Year Olds |
| Immigrants | Uruguay | 99.4 /100 | #82 | Exceptional 18.8% |
| Immigrants | Indonesia | 99.4 /100 | #83 | Exceptional 18.9% |
| Burmese | 99.2 /100 | #84 | Exceptional 18.9% |
| Immigrants | Armenia | 99.2 /100 | #85 | Exceptional 18.9% |
| Immigrants | Iraq | 99.2 /100 | #86 | Exceptional 18.9% |
| Immigrants | Jamaica | 99.2 /100 | #87 | Exceptional 18.9% |
| Croatians | 99.1 /100 | #88 | Exceptional 19.0% |
| Immigrants | Cabo Verde | 99.0 /100 | #89 | Exceptional 19.0% |
| Afghans | 99.0 /100 | #90 | Exceptional 19.0% |
| Romanians | 98.9 /100 | #91 | Exceptional 19.0% |
| Filipinos | 98.9 /100 | #92 | Exceptional 19.0% |
| Haitians | 98.9 /100 | #93 | Exceptional 19.0% |
| Ukrainians | 98.8 /100 | #94 | Exceptional 19.0% |
| Guamanians/Chamorros | 98.8 /100 | #95 | Exceptional 19.0% |
| Sierra Leoneans | 98.7 /100 | #96 | Exceptional 19.0% |