Arapaho vs Immigrants from Cabo Verde In Labor Force | Age 25-29
COMPARE
Arapaho
Immigrants from Cabo Verde
In Labor Force | Age 25-29
In Labor Force | Age 25-29 Comparison
Arapaho
Immigrants from Cabo Verde
76.6%
IN LABOR FORCE | AGE 25-29
0.0/ 100
METRIC RATING
343rd/ 347
METRIC RANK
86.2%
IN LABOR FORCE | AGE 25-29
100.0/ 100
METRIC RATING
8th/ 347
METRIC RANK
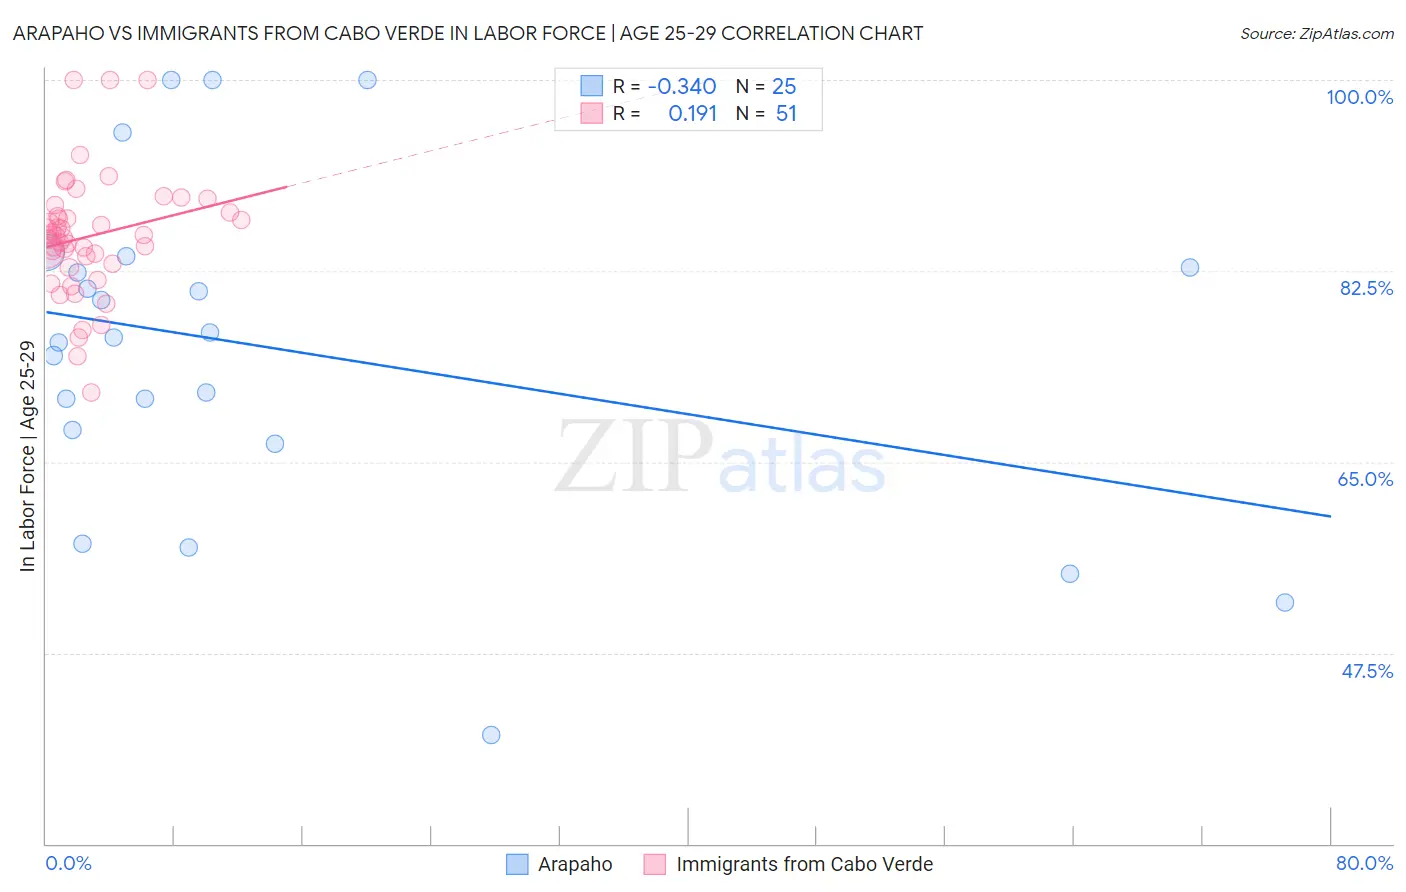
Arapaho vs Immigrants from Cabo Verde In Labor Force | Age 25-29 Correlation Chart
The statistical analysis conducted on geographies consisting of 29,773,851 people shows a mild negative correlation between the proportion of Arapaho and labor force participation rate among population between the ages 25 and 29 in the United States with a correlation coefficient (R) of -0.340 and weighted average of 76.6%. Similarly, the statistical analysis conducted on geographies consisting of 38,156,394 people shows a poor positive correlation between the proportion of Immigrants from Cabo Verde and labor force participation rate among population between the ages 25 and 29 in the United States with a correlation coefficient (R) of 0.191 and weighted average of 86.2%, a difference of 12.6%.
In Labor Force | Age 25-29 Correlation Summary
| Measurement | Arapaho | Immigrants from Cabo Verde |
| Minimum | 40.0% | 71.4% |
| Maximum | 100.0% | 100.0% |
| Range | 60.0% | 28.6% |
| Mean | 75.3% | 85.7% |
| Median | 76.4% | 85.7% |
| Interquartile 25% (IQ1) | 67.3% | 83.2% |
| Interquartile 75% (IQ3) | 83.3% | 87.9% |
| Interquartile Range (IQR) | 16.0% | 4.7% |
| Standard Deviation (Sample) | 15.3% | 5.6% |
| Standard Deviation (Population) | 15.0% | 5.5% |
Similar Demographics by In Labor Force | Age 25-29
Demographics Similar to Arapaho by In Labor Force | Age 25-29
In terms of in labor force | age 25-29, the demographic groups most similar to Arapaho are Hopi (76.5%, a difference of 0.060%), Pueblo (77.5%, a difference of 1.2%), Tohono O'odham (77.5%, a difference of 1.2%), Paiute (78.1%, a difference of 2.0%), and Immigrants from Yemen (78.2%, a difference of 2.2%).
| Demographics | Rating | Rank | In Labor Force | Age 25-29 |
| Sioux | 0.0 /100 | #333 | Tragic 79.7% |
| Yuman | 0.0 /100 | #334 | Tragic 79.3% |
| Natives/Alaskans | 0.0 /100 | #335 | Tragic 79.3% |
| Apache | 0.0 /100 | #336 | Tragic 79.2% |
| Crow | 0.0 /100 | #337 | Tragic 78.6% |
| Lumbee | 0.0 /100 | #338 | Tragic 78.3% |
| Immigrants | Yemen | 0.0 /100 | #339 | Tragic 78.2% |
| Paiute | 0.0 /100 | #340 | Tragic 78.1% |
| Tohono O'odham | 0.0 /100 | #341 | Tragic 77.5% |
| Pueblo | 0.0 /100 | #342 | Tragic 77.5% |
| Arapaho | 0.0 /100 | #343 | Tragic 76.6% |
| Hopi | 0.0 /100 | #344 | Tragic 76.5% |
| Navajo | 0.0 /100 | #345 | Tragic 74.6% |
| Pima | 0.0 /100 | #346 | Tragic 74.3% |
| Yup'ik | 0.0 /100 | #347 | Tragic 73.1% |
Demographics Similar to Immigrants from Cabo Verde by In Labor Force | Age 25-29
In terms of in labor force | age 25-29, the demographic groups most similar to Immigrants from Cabo Verde are Ethiopian (86.2%, a difference of 0.030%), Immigrants from Bosnia and Herzegovina (86.3%, a difference of 0.070%), Liberian (86.1%, a difference of 0.080%), Immigrants from Ethiopia (86.1%, a difference of 0.080%), and Immigrants from Lithuania (86.1%, a difference of 0.10%).
| Demographics | Rating | Rank | In Labor Force | Age 25-29 |
| Tsimshian | 100.0 /100 | #1 | Exceptional 88.7% |
| Immigrants | Somalia | 100.0 /100 | #2 | Exceptional 87.1% |
| Somalis | 100.0 /100 | #3 | Exceptional 87.1% |
| Carpatho Rusyns | 100.0 /100 | #4 | Exceptional 87.0% |
| Luxembourgers | 100.0 /100 | #5 | Exceptional 86.9% |
| Slovenes | 100.0 /100 | #6 | Exceptional 86.4% |
| Immigrants | Bosnia and Herzegovina | 100.0 /100 | #7 | Exceptional 86.3% |
| Immigrants | Cabo Verde | 100.0 /100 | #8 | Exceptional 86.2% |
| Ethiopians | 100.0 /100 | #9 | Exceptional 86.2% |
| Liberians | 100.0 /100 | #10 | Exceptional 86.1% |
| Immigrants | Ethiopia | 100.0 /100 | #11 | Exceptional 86.1% |
| Immigrants | Lithuania | 100.0 /100 | #12 | Exceptional 86.1% |
| Norwegians | 100.0 /100 | #13 | Exceptional 86.1% |
| Latvians | 100.0 /100 | #14 | Exceptional 86.1% |
| Bolivians | 100.0 /100 | #15 | Exceptional 86.1% |