Immigrants from Asia vs Immigrants from Cabo Verde Female Poverty Among 18-24 Year Olds

COMPARE

Immigrants from Asia
Race
Ancestry
AfghanAfricanAlaska NativeAlaskan AthabascanAlbanianAleutAlsatianAmericanApacheArabArapahoArgentineanArmenianAssyrian/Chaldean/SyriacAustralianAustrianBahamianBangladeshiBarbadianBasqueBelgianBelizeanBermudanBhutaneseBlackfeetBolivianBrazilianBritishBritish West IndianBulgarianBurmeseCajunCambodianCanadianCape VerdeanCarpatho RusynCelticCentral AmericanCentral American IndianCherokeeCheyenneChickasawChileanChineseChippewaChoctawColombianColvilleComancheCosta RicanCreeCreekCroatianCrowCubanCypriotCzechCzechoslovakianDanishDelawareDominicanDutchDutch West IndianEastern EuropeanEcuadorianEgyptianEnglishEstonianEthiopianEuropeanFijianFilipinoFinnishFrenchFrench American IndianFrench CanadianGermanGerman RussianGhanaianGreekGuamanian/ChamorroGuatemalanGuyaneseHaitianHmongHonduranHopiHoumaHungarianIcelanderIndian (Asian)IndonesianInupiatIranianIraqiIrishIroquoisIsraeliItalianJamaicanJapaneseJordanianKenyanKiowaKoreanLaotianLatvianLebaneseLiberianLithuanianLumbeeLuxembourgerMacedonianMalaysianMalteseMarshalleseMenomineeMexicanMexican American IndianMongolianMoroccanNative HawaiianNavajoNepaleseNew ZealanderNicaraguanNigerianNorthern EuropeanNorwegianOkinawanOsageOttawaPaiutePakistaniPalestinianPanamanianParaguayanPennsylvania GermanPeruvianPimaPolishPortuguesePotawatomiPuebloPuerto RicanPuget Sound SalishRomanianRussianSalvadoranSamoanScandinavianScotch-IrishScottishSeminoleSenegaleseSerbianShoshoneSierra LeoneanSiouxSlavicSlovakSloveneSomaliSouth AfricanSouth AmericanSouth American IndianSoviet UnionSpaniardSpanishSpanish AmericanSpanish American IndianSri LankanSubsaharan AfricanSudaneseSwedishSwissSyrianTaiwaneseThaiTlingit-HaidaTohono O'OdhamTonganTrinidadian and TobagonianTsimshianTurkishU.S. Virgin IslanderUgandanUkrainianUruguayanUteVenezuelanVietnameseWelshWest IndianYakamaYaquiYugoslavianYumanYup'ikZimbabwean
Immigration
NonimmigrantsImmigrantsAfghanistanAfricaAlbaniaArgentinaArmeniaAsiaAustraliaAustriaBahamasBangladeshBarbadosBelarusBelgiumBelizeBoliviaBosnia and HerzegovinaBrazilBulgariaBurma/MyanmarCambodiaCameroonCanadaCaribbeanCentral AmericaChileChinaColombiaCongoCosta RicaCroatiaCubaCzechoslovakiaDenmarkDominicaDominican RepublicEastern AfricaEastern AsiaEastern EuropeEcuadorEgyptEl SalvadorEnglandEritreaEthiopiaEuropeFijiFranceGermanyGhanaGreeceGrenadaGuatemalaGuyanaHaitiHondurasHong KongHungaryIndiaIndonesiaIranIraqIrelandIsraelItalyJamaicaJapanJordanKazakhstanKenyaKoreaKuwaitLaosLatin AmericaLatviaLebanonLiberiaLithuaniaMalaysiaMexicoMicronesiaMiddle AfricaMoldovaMoroccoNepalNetherlandsNicaraguaNigeriaNorth AmericaNorth MacedoniaNorthern AfricaNorthern EuropeNorwayOceaniaPakistanPanamaPeruPhilippinesPolandPortugalRomaniaRussiaSaudi ArabiaScotlandSenegalSerbiaSierra LeoneSingaporeSomaliaSouth AfricaSouth AmericaSouth Central AsiaSouth Eastern AsiaSouthern EuropeSpainSri LankaSt. Vincent and the GrenadinesSudanSwedenSwitzerlandSyriaTaiwanThailandTrinidad and TobagoTurkeyUgandaUkraineUruguayUzbekistanVenezuelaVietnamWest IndiesWestern AfricaWestern AsiaWestern EuropeYemenZaireZimbabweAzores
Immigrants from Cabo Verde
Race
Ancestry
AfghanAfricanAlaska NativeAlaskan AthabascanAlbanianAleutAlsatianAmericanApacheArabArapahoArgentineanArmenianAssyrian/Chaldean/SyriacAustralianAustrianBahamianBangladeshiBarbadianBasqueBelgianBelizeanBermudanBhutaneseBlackfeetBolivianBrazilianBritishBritish West IndianBulgarianBurmeseCajunCambodianCanadianCape VerdeanCarpatho RusynCelticCentral AmericanCentral American IndianCherokeeCheyenneChickasawChileanChineseChippewaChoctawColombianColvilleComancheCosta RicanCreeCreekCroatianCrowCubanCypriotCzechCzechoslovakianDanishDelawareDominicanDutchDutch West IndianEastern EuropeanEcuadorianEgyptianEnglishEstonianEthiopianEuropeanFijianFilipinoFinnishFrenchFrench American IndianFrench CanadianGermanGerman RussianGhanaianGreekGuamanian/ChamorroGuatemalanGuyaneseHaitianHmongHonduranHopiHoumaHungarianIcelanderIndian (Asian)IndonesianInupiatIranianIraqiIrishIroquoisIsraeliItalianJamaicanJapaneseJordanianKenyanKiowaKoreanLaotianLatvianLebaneseLiberianLithuanianLumbeeLuxembourgerMacedonianMalaysianMalteseMarshalleseMenomineeMexicanMexican American IndianMongolianMoroccanNative HawaiianNavajoNepaleseNew ZealanderNicaraguanNigerianNorthern EuropeanNorwegianOkinawanOsageOttawaPaiutePakistaniPalestinianPanamanianParaguayanPennsylvania GermanPeruvianPimaPolishPortuguesePotawatomiPuebloPuerto RicanPuget Sound SalishRomanianRussianSalvadoranSamoanScandinavianScotch-IrishScottishSeminoleSenegaleseSerbianShoshoneSierra LeoneanSiouxSlavicSlovakSloveneSomaliSouth AfricanSouth AmericanSouth American IndianSoviet UnionSpaniardSpanishSpanish AmericanSpanish American IndianSri LankanSubsaharan AfricanSudaneseSwedishSwissSyrianTaiwaneseThaiTlingit-HaidaTohono O'OdhamTonganTrinidadian and TobagonianTsimshianTurkishU.S. Virgin IslanderUgandanUkrainianUruguayanUteVenezuelanVietnameseWelshWest IndianYakamaYaquiYugoslavianYumanYup'ikZimbabwean
Immigration
NonimmigrantsImmigrantsAfghanistanAfricaAlbaniaArgentinaArmeniaAustraliaAustriaBahamasBangladeshBarbadosBelarusBelgiumBelizeBoliviaBosnia and HerzegovinaBrazilBulgariaBurma/MyanmarCabo VerdeCambodiaCameroonCanadaCaribbeanCentral AmericaChileChinaColombiaCongoCosta RicaCroatiaCubaCzechoslovakiaDenmarkDominicaDominican RepublicEastern AfricaEastern AsiaEastern EuropeEcuadorEgyptEl SalvadorEnglandEritreaEthiopiaEuropeFijiFranceGermanyGhanaGreeceGrenadaGuatemalaGuyanaHaitiHondurasHong KongHungaryIndiaIndonesiaIranIraqIrelandIsraelItalyJamaicaJapanJordanKazakhstanKenyaKoreaKuwaitLaosLatin AmericaLatviaLebanonLiberiaLithuaniaMalaysiaMexicoMicronesiaMiddle AfricaMoldovaMoroccoNepalNetherlandsNicaraguaNigeriaNorth AmericaNorth MacedoniaNorthern AfricaNorthern EuropeNorwayOceaniaPakistanPanamaPeruPhilippinesPolandPortugalRomaniaRussiaSaudi ArabiaScotlandSenegalSerbiaSierra LeoneSingaporeSomaliaSouth AfricaSouth AmericaSouth Central AsiaSouth Eastern AsiaSouthern EuropeSpainSri LankaSt. Vincent and the GrenadinesSudanSwedenSwitzerlandSyriaTaiwanThailandTrinidad and TobagoTurkeyUgandaUkraineUruguayUzbekistanVenezuelaVietnamWest IndiesWestern AfricaWestern AsiaWestern EuropeYemenZaireZimbabweAzores
Female Poverty Among 18-24 Year Olds
Income
Poverty
Unemployment
Labor Participation
Family Structure
Vehicle Availability
Education Level
Disability

Female Poverty Among 18-24 Year Olds Comparison

Immigrants from Asia

Immigrants from Cabo Verde

Exceptional
Exceptional
18.6%
FEMALE POVERTY AMONG 18-24 YEAR OLDS
99.8/ 100
METRIC RATING
64th/ 347
METRIC RANK
19.0%
FEMALE POVERTY AMONG 18-24 YEAR OLDS
99.0/ 100
METRIC RATING
89th/ 347
METRIC RANK

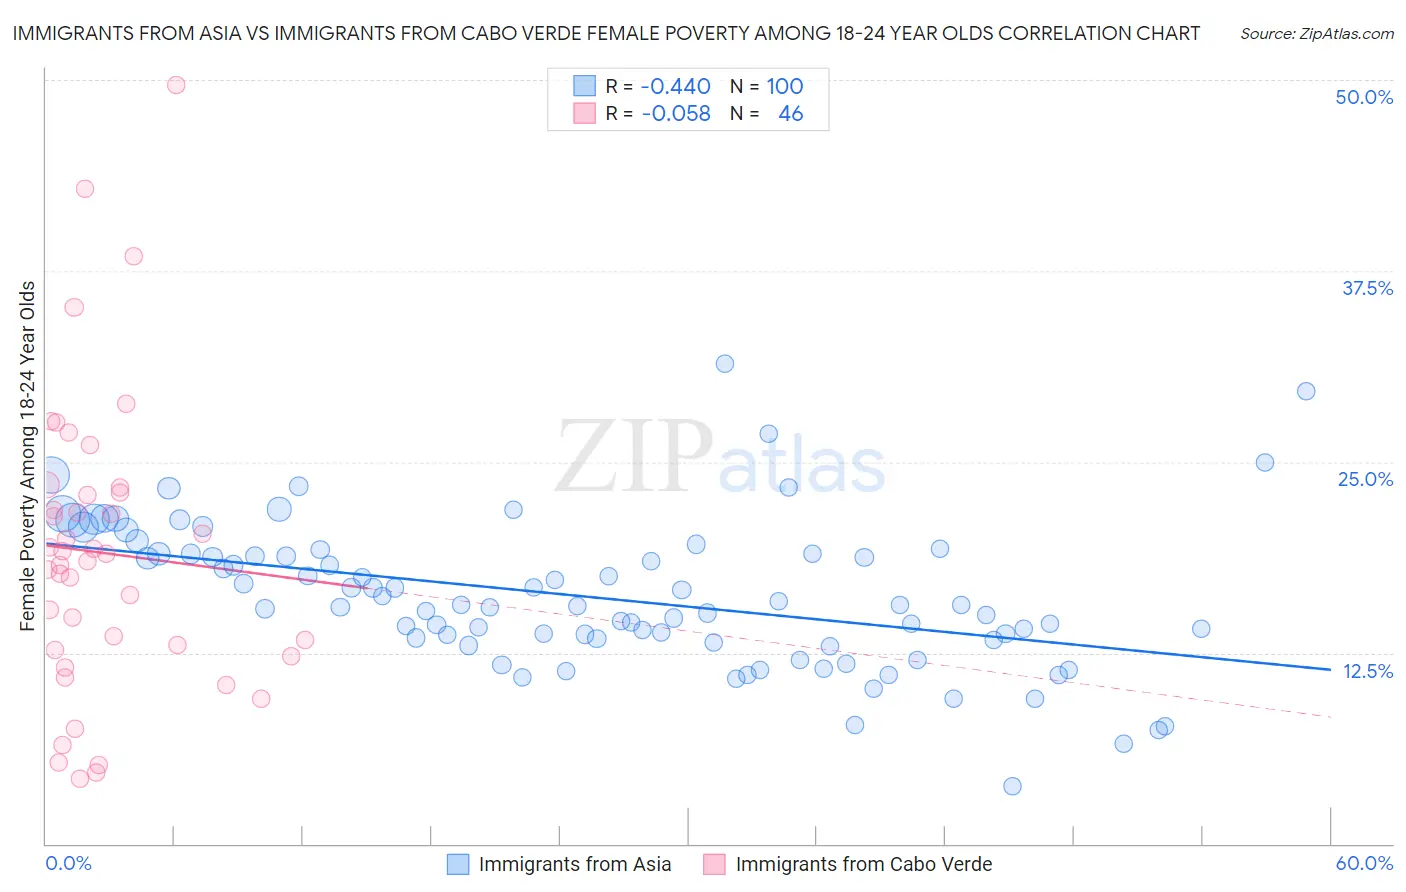
Immigrants from Asia vs Immigrants from Cabo Verde Female Poverty Among 18-24 Year Olds Correlation Chart

The statistical analysis conducted on geographies consisting of 522,222,077 people shows a moderate negative correlation between the proportion of Immigrants from Asia and poverty level among females between the ages 18 and 24 in the United States with a correlation coefficient (R) of -0.440 and weighted average of 18.6%. Similarly, the statistical analysis conducted on geographies consisting of 37,707,106 people shows a slight negative correlation between the proportion of Immigrants from Cabo Verde and poverty level among females between the ages 18 and 24 in the United States with a correlation coefficient (R) of -0.058 and weighted average of 19.0%, a difference of 2.2%.
Immigrants from Asia vs Immigrants from Cabo Verde Female Poverty Among 18-24 Year Olds

Female Poverty Among 18-24 Year Olds Correlation Summary

MeasurementImmigrants from AsiaImmigrants from Cabo Verde
Minimum3.7%4.2%
Maximum31.4%49.6%
Range27.7%45.4%
Mean16.1%19.0%
Median15.6%18.7%
Interquartile 25% (IQ1)13.4%12.7%
Interquartile 75% (IQ3)19.0%23.0%
Interquartile Range (IQR)5.6%10.3%
Standard Deviation (Sample)4.8%9.7%
Standard Deviation (Population)4.7%9.6%

Similar Demographics by Female Poverty Among 18-24 Year Olds

Demographics Similar to Immigrants from Asia by Female Poverty Among 18-24 Year Olds

In terms of female poverty among 18-24 year olds, the demographic groups most similar to Immigrants from Asia are Immigrants from Belarus (18.5%, a difference of 0.030%), Immigrants from Scotland (18.6%, a difference of 0.030%), Greek (18.5%, a difference of 0.040%), Immigrants from Albania (18.5%, a difference of 0.11%), and Immigrants from Brazil (18.5%, a difference of 0.15%).
DemographicsRating | RankFemale Poverty Among 18-24 Year Olds
Immigrants | Italy
99.9
/100
|
#57
Exceptional
18.4%
Immigrants | Ukraine
99.9
/100
|
#58
Exceptional
18.4%
Egyptians
99.9
/100
|
#59
Exceptional
18.5%
Immigrants | Brazil
99.8
/100
|
#60
Exceptional
18.5%
Immigrants | Albania
99.8
/100
|
#61
Exceptional
18.5%
Greeks
99.8
/100
|
#62
Exceptional
18.5%
Immigrants | Belarus
99.8
/100
|
#63
Exceptional
18.5%
Immigrants | Asia
99.8
/100
|
#64
Exceptional
18.6%
Immigrants | Scotland
99.8
/100
|
#65
Exceptional
18.6%
Jordanians
99.8
/100
|
#66
Exceptional
18.6%
Immigrants | Korea
99.8
/100
|
#67
Exceptional
18.6%
Brazilians
99.8
/100
|
#68
Exceptional
18.6%
Immigrants | Bulgaria
99.7
/100
|
#69
Exceptional
18.6%
Immigrants | Costa Rica
99.7
/100
|
#70
Exceptional
18.7%
Immigrants | Haiti
99.7
/100
|
#71
Exceptional
18.7%

Demographics Similar to Immigrants from Cabo Verde by Female Poverty Among 18-24 Year Olds

In terms of female poverty among 18-24 year olds, the demographic groups most similar to Immigrants from Cabo Verde are Croatian (19.0%, a difference of 0.020%), Afghan (19.0%, a difference of 0.030%), Romanian (19.0%, a difference of 0.12%), Immigrants from Jamaica (18.9%, a difference of 0.17%), and Filipino (19.0%, a difference of 0.17%).
DemographicsRating | RankFemale Poverty Among 18-24 Year Olds
Immigrants | Uruguay
99.4
/100
|
#82
Exceptional
18.8%
Immigrants | Indonesia
99.4
/100
|
#83
Exceptional
18.9%
Burmese
99.2
/100
|
#84
Exceptional
18.9%
Immigrants | Armenia
99.2
/100
|
#85
Exceptional
18.9%
Immigrants | Iraq
99.2
/100
|
#86
Exceptional
18.9%
Immigrants | Jamaica
99.2
/100
|
#87
Exceptional
18.9%
Croatians
99.1
/100
|
#88
Exceptional
19.0%
Immigrants | Cabo Verde
99.0
/100
|
#89
Exceptional
19.0%
Afghans
99.0
/100
|
#90
Exceptional
19.0%
Romanians
98.9
/100
|
#91
Exceptional
19.0%
Filipinos
98.9
/100
|
#92
Exceptional
19.0%
Haitians
98.9
/100
|
#93
Exceptional
19.0%
Ukrainians
98.8
/100
|
#94
Exceptional
19.0%
Guamanians/Chamorros
98.8
/100
|
#95
Exceptional
19.0%
Sierra Leoneans
98.7
/100
|
#96
Exceptional
19.0%