Venezuelan vs Greek Seniors Poverty Over the Age of 65
COMPARE
Venezuelan
Greek
Seniors Poverty Over the Age of 65
Seniors Poverty Over the Age of 65 Comparison
Venezuelans
Greeks
12.5%
SENIORS POVERTY OVER THE AGE OF 65
0.1/ 100
METRIC RATING
262nd/ 347
METRIC RANK
9.6%
SENIORS POVERTY OVER THE AGE OF 65
99.6/ 100
METRIC RATING
39th/ 347
METRIC RANK
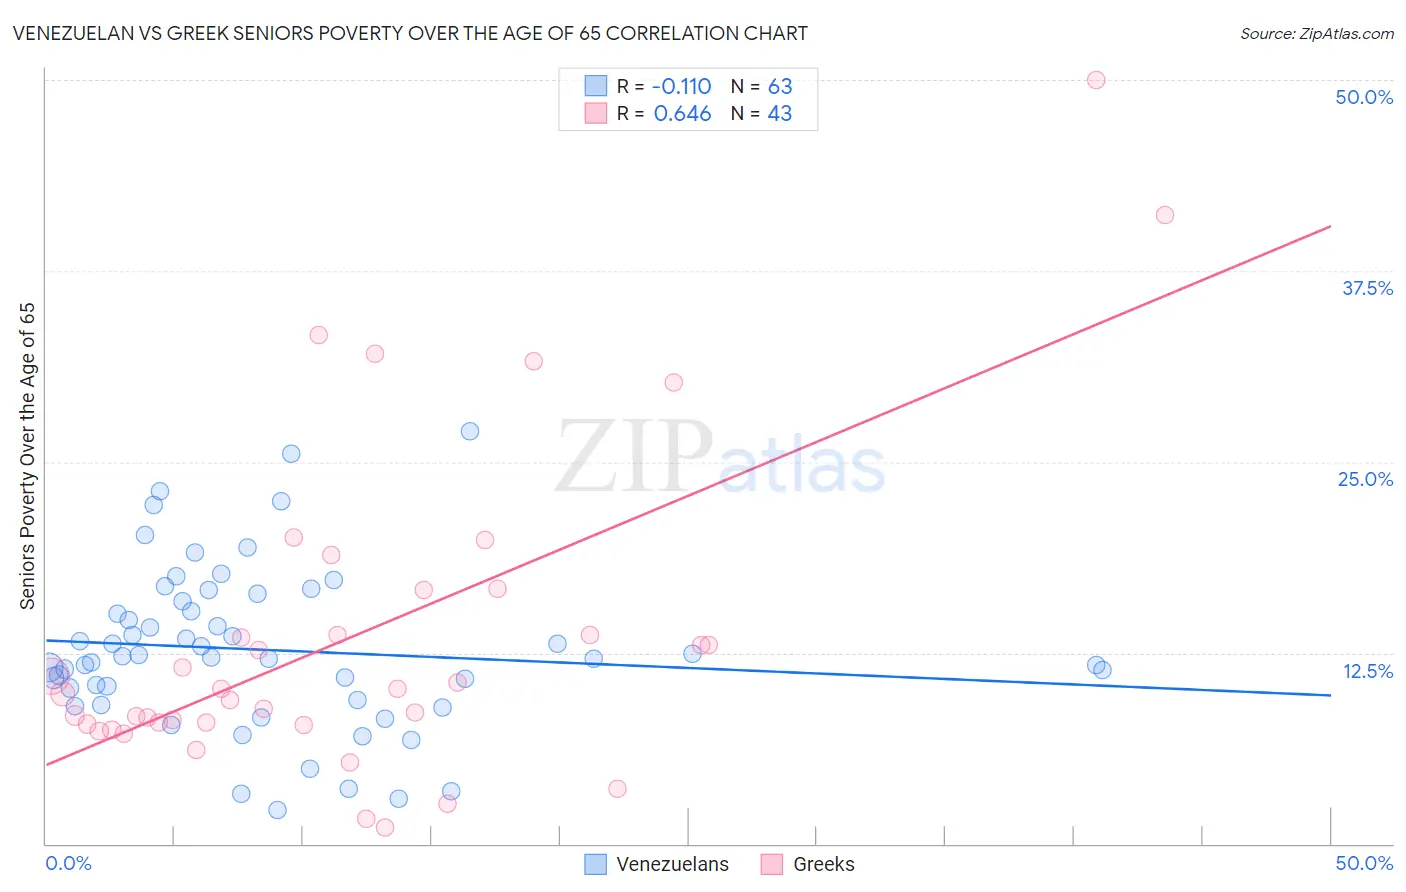
Venezuelan vs Greek Seniors Poverty Over the Age of 65 Correlation Chart
The statistical analysis conducted on geographies consisting of 305,272,622 people shows a poor negative correlation between the proportion of Venezuelans and poverty level among seniors over the age of 65 in the United States with a correlation coefficient (R) of -0.110 and weighted average of 12.5%. Similarly, the statistical analysis conducted on geographies consisting of 480,237,889 people shows a significant positive correlation between the proportion of Greeks and poverty level among seniors over the age of 65 in the United States with a correlation coefficient (R) of 0.646 and weighted average of 9.6%, a difference of 31.0%.
Seniors Poverty Over the Age of 65 Correlation Summary
| Measurement | Venezuelan | Greek |
| Minimum | 2.2% | 1.0% |
| Maximum | 27.0% | 50.0% |
| Range | 24.8% | 49.0% |
| Mean | 12.7% | 13.7% |
| Median | 12.2% | 10.1% |
| Interquartile 25% (IQ1) | 9.4% | 7.8% |
| Interquartile 75% (IQ3) | 15.9% | 16.6% |
| Interquartile Range (IQR) | 6.5% | 8.8% |
| Standard Deviation (Sample) | 5.3% | 10.6% |
| Standard Deviation (Population) | 5.3% | 10.4% |
Similar Demographics by Seniors Poverty Over the Age of 65
Demographics Similar to Venezuelans by Seniors Poverty Over the Age of 65
In terms of seniors poverty over the age of 65, the demographic groups most similar to Venezuelans are Soviet Union (12.6%, a difference of 0.17%), Colombian (12.5%, a difference of 0.20%), Inupiat (12.6%, a difference of 0.23%), Immigrants from Western Africa (12.6%, a difference of 0.32%), and South American (12.5%, a difference of 0.44%).
| Demographics | Rating | Rank | Seniors Poverty Over the Age of 65 |
| Mexican American Indians | 0.3 /100 | #255 | Tragic 12.4% |
| Immigrants | Panama | 0.2 /100 | #256 | Tragic 12.4% |
| Immigrants | Immigrants | 0.2 /100 | #257 | Tragic 12.4% |
| Dutch West Indians | 0.2 /100 | #258 | Tragic 12.4% |
| Ghanaians | 0.2 /100 | #259 | Tragic 12.4% |
| South Americans | 0.2 /100 | #260 | Tragic 12.5% |
| Colombians | 0.2 /100 | #261 | Tragic 12.5% |
| Venezuelans | 0.1 /100 | #262 | Tragic 12.5% |
| Soviet Union | 0.1 /100 | #263 | Tragic 12.6% |
| Inupiat | 0.1 /100 | #264 | Tragic 12.6% |
| Immigrants | Western Africa | 0.1 /100 | #265 | Tragic 12.6% |
| Africans | 0.1 /100 | #266 | Tragic 12.6% |
| Blackfeet | 0.1 /100 | #267 | Tragic 12.6% |
| Immigrants | Somalia | 0.1 /100 | #268 | Tragic 12.6% |
| Immigrants | Venezuela | 0.1 /100 | #269 | Tragic 12.7% |
Demographics Similar to Greeks by Seniors Poverty Over the Age of 65
In terms of seniors poverty over the age of 65, the demographic groups most similar to Greeks are Assyrian/Chaldean/Syriac (9.6%, a difference of 0.12%), Immigrants from North Macedonia (9.6%, a difference of 0.28%), Zimbabwean (9.6%, a difference of 0.44%), Eastern European (9.6%, a difference of 0.54%), and Belgian (9.5%, a difference of 0.63%).
| Demographics | Rating | Rank | Seniors Poverty Over the Age of 65 |
| Northern Europeans | 99.8 /100 | #32 | Exceptional 9.4% |
| Native Hawaiians | 99.8 /100 | #33 | Exceptional 9.4% |
| British | 99.8 /100 | #34 | Exceptional 9.4% |
| Latvians | 99.8 /100 | #35 | Exceptional 9.5% |
| Czechoslovakians | 99.8 /100 | #36 | Exceptional 9.5% |
| Scotch-Irish | 99.7 /100 | #37 | Exceptional 9.5% |
| Belgians | 99.7 /100 | #38 | Exceptional 9.5% |
| Greeks | 99.6 /100 | #39 | Exceptional 9.6% |
| Assyrians/Chaldeans/Syriacs | 99.6 /100 | #40 | Exceptional 9.6% |
| Immigrants | North Macedonia | 99.6 /100 | #41 | Exceptional 9.6% |
| Zimbabweans | 99.6 /100 | #42 | Exceptional 9.6% |
| Eastern Europeans | 99.6 /100 | #43 | Exceptional 9.6% |
| Austrians | 99.5 /100 | #44 | Exceptional 9.6% |
| Estonians | 99.5 /100 | #45 | Exceptional 9.6% |
| Immigrants | Taiwan | 99.5 /100 | #46 | Exceptional 9.7% |