American vs Immigrants from Micronesia 12th Grade, No Diploma
COMPARE
American
Immigrants from Micronesia
12th Grade, No Diploma
12th Grade, No Diploma Comparison
Americans
Immigrants from Micronesia
91.0%
12TH GRADE, NO DIPLOMA
32.6/ 100
METRIC RATING
188th/ 347
METRIC RANK
90.6%
12TH GRADE, NO DIPLOMA
11.0/ 100
METRIC RATING
208th/ 347
METRIC RANK
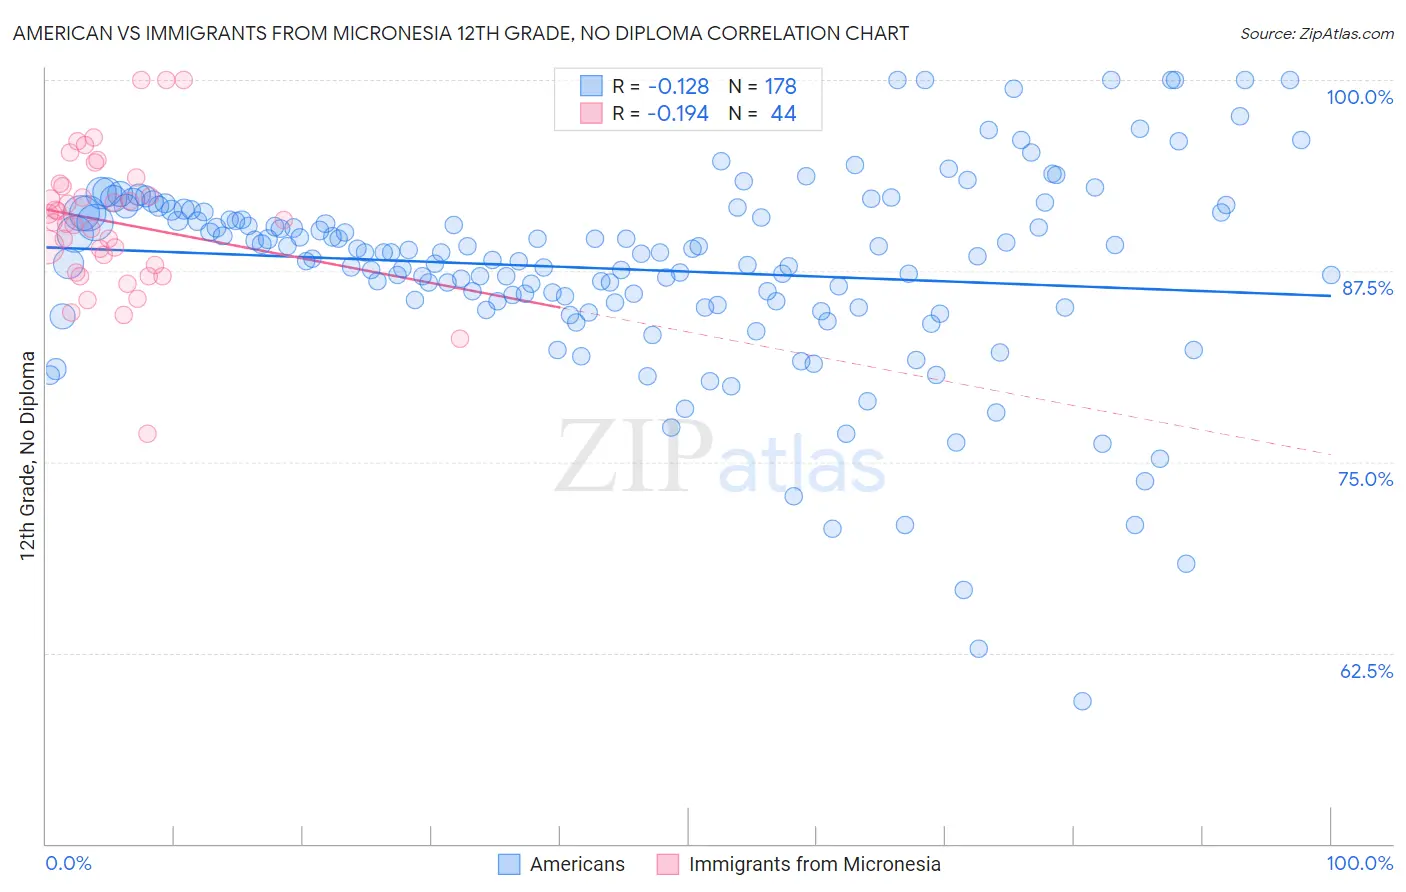
American vs Immigrants from Micronesia 12th Grade, No Diploma Correlation Chart
The statistical analysis conducted on geographies consisting of 581,993,188 people shows a poor negative correlation between the proportion of Americans and percentage of population with at least 12th grade (no diploma) education in the United States with a correlation coefficient (R) of -0.128 and weighted average of 91.0%. Similarly, the statistical analysis conducted on geographies consisting of 61,609,499 people shows a poor negative correlation between the proportion of Immigrants from Micronesia and percentage of population with at least 12th grade (no diploma) education in the United States with a correlation coefficient (R) of -0.194 and weighted average of 90.6%, a difference of 0.42%.
12th Grade, No Diploma Correlation Summary
| Measurement | American | Immigrants from Micronesia |
| Minimum | 59.3% | 76.9% |
| Maximum | 100.0% | 100.0% |
| Range | 40.7% | 23.1% |
| Mean | 87.6% | 90.7% |
| Median | 88.7% | 90.8% |
| Interquartile 25% (IQ1) | 85.3% | 87.7% |
| Interquartile 75% (IQ3) | 91.3% | 93.1% |
| Interquartile Range (IQR) | 6.1% | 5.5% |
| Standard Deviation (Sample) | 6.7% | 4.6% |
| Standard Deviation (Population) | 6.6% | 4.5% |
Demographics Similar to Americans and Immigrants from Micronesia by 12th Grade, No Diploma
In terms of 12th grade, no diploma, the demographic groups most similar to Americans are Immigrants from Uganda (90.9%, a difference of 0.010%), Afghan (90.9%, a difference of 0.040%), Moroccan (90.9%, a difference of 0.050%), Immigrants from Eastern Africa (90.9%, a difference of 0.070%), and Immigrants from Ethiopia (90.9%, a difference of 0.080%). Similarly, the demographic groups most similar to Immigrants from Micronesia are Armenian (90.6%, a difference of 0.020%), Immigrants from Bolivia (90.6%, a difference of 0.040%), Immigrants from Sierra Leone (90.7%, a difference of 0.11%), French American Indian (90.7%, a difference of 0.12%), and Tongan (90.7%, a difference of 0.14%).
| Demographics | Rating | Rank | 12th Grade, No Diploma |
| Americans | 32.6 /100 | #188 | Fair 91.0% |
| Immigrants | Uganda | 31.6 /100 | #189 | Fair 90.9% |
| Afghans | 29.9 /100 | #190 | Fair 90.9% |
| Moroccans | 28.8 /100 | #191 | Fair 90.9% |
| Immigrants | Eastern Africa | 27.7 /100 | #192 | Fair 90.9% |
| Immigrants | Ethiopia | 27.2 /100 | #193 | Fair 90.9% |
| Immigrants | Oceania | 26.0 /100 | #194 | Fair 90.9% |
| Koreans | 24.5 /100 | #195 | Fair 90.8% |
| Panamanians | 22.8 /100 | #196 | Fair 90.8% |
| Immigrants | Sudan | 22.6 /100 | #197 | Fair 90.8% |
| Samoans | 20.4 /100 | #198 | Fair 90.8% |
| Immigrants | Southern Europe | 19.9 /100 | #199 | Poor 90.8% |
| Liberians | 19.8 /100 | #200 | Poor 90.8% |
| Hawaiians | 19.7 /100 | #201 | Poor 90.8% |
| Marshallese | 18.2 /100 | #202 | Poor 90.7% |
| Tongans | 16.1 /100 | #203 | Poor 90.7% |
| French American Indians | 15.5 /100 | #204 | Poor 90.7% |
| Immigrants | Sierra Leone | 14.9 /100 | #205 | Poor 90.7% |
| Immigrants | Bolivia | 12.3 /100 | #206 | Poor 90.6% |
| Armenians | 11.6 /100 | #207 | Poor 90.6% |
| Immigrants | Micronesia | 11.0 /100 | #208 | Poor 90.6% |