Aleut vs Norwegian Female Poverty Among 18-24 Year Olds
COMPARE
Aleut
Norwegian
Female Poverty Among 18-24 Year Olds
Female Poverty Among 18-24 Year Olds Comparison
Aleuts
Norwegians
20.9%
FEMALE POVERTY AMONG 18-24 YEAR OLDS
3.3/ 100
METRIC RATING
245th/ 347
METRIC RANK
20.7%
FEMALE POVERTY AMONG 18-24 YEAR OLDS
7.3/ 100
METRIC RATING
225th/ 347
METRIC RANK
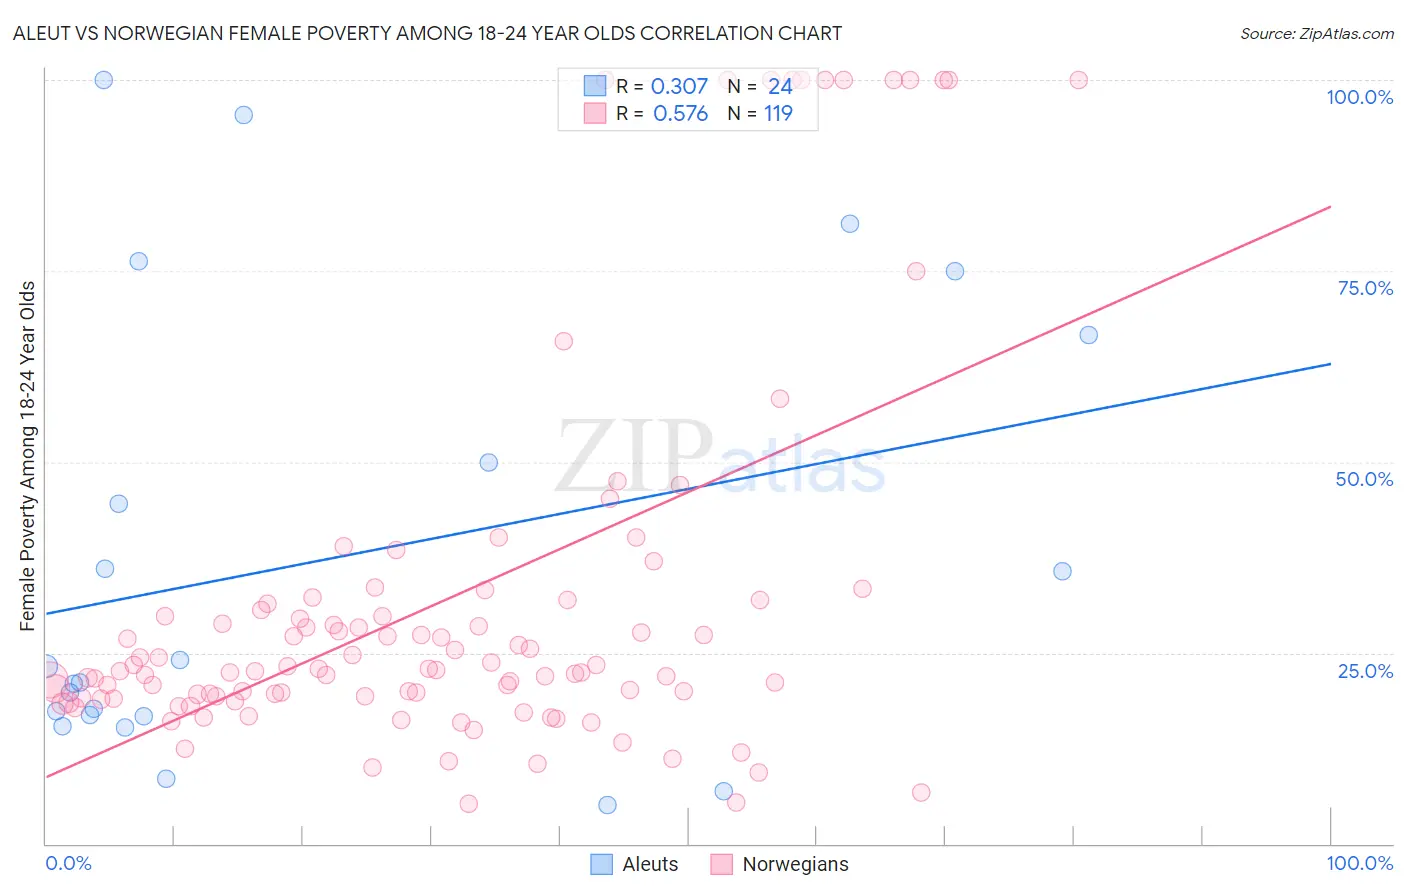
Aleut vs Norwegian Female Poverty Among 18-24 Year Olds Correlation Chart
The statistical analysis conducted on geographies consisting of 61,342,300 people shows a mild positive correlation between the proportion of Aleuts and poverty level among females between the ages 18 and 24 in the United States with a correlation coefficient (R) of 0.307 and weighted average of 20.9%. Similarly, the statistical analysis conducted on geographies consisting of 505,664,525 people shows a substantial positive correlation between the proportion of Norwegians and poverty level among females between the ages 18 and 24 in the United States with a correlation coefficient (R) of 0.576 and weighted average of 20.7%, a difference of 0.98%.
Female Poverty Among 18-24 Year Olds Correlation Summary
| Measurement | Aleut | Norwegian |
| Minimum | 5.1% | 5.2% |
| Maximum | 100.0% | 100.0% |
| Range | 94.9% | 94.8% |
| Mean | 37.1% | 31.9% |
| Median | 22.1% | 22.7% |
| Interquartile 25% (IQ1) | 16.8% | 19.1% |
| Interquartile 75% (IQ3) | 58.3% | 31.5% |
| Interquartile Range (IQR) | 41.5% | 12.4% |
| Standard Deviation (Sample) | 29.4% | 25.1% |
| Standard Deviation (Population) | 28.8% | 25.0% |
Demographics Similar to Aleuts and Norwegians by Female Poverty Among 18-24 Year Olds
In terms of female poverty among 18-24 year olds, the demographic groups most similar to Aleuts are Immigrants from Thailand (20.9%, a difference of 0.030%), Marshallese (20.9%, a difference of 0.040%), Israeli (20.9%, a difference of 0.27%), Immigrants from Eritrea (20.9%, a difference of 0.28%), and Luxembourger (20.9%, a difference of 0.30%). Similarly, the demographic groups most similar to Norwegians are Estonian (20.7%, a difference of 0.020%), Immigrants from Sweden (20.7%, a difference of 0.080%), Ghanaian (20.8%, a difference of 0.15%), Australian (20.8%, a difference of 0.21%), and White/Caucasian (20.8%, a difference of 0.22%).
| Demographics | Rating | Rank | Female Poverty Among 18-24 Year Olds |
| Norwegians | 7.3 /100 | #225 | Tragic 20.7% |
| Estonians | 7.2 /100 | #226 | Tragic 20.7% |
| Immigrants | Sweden | 6.8 /100 | #227 | Tragic 20.7% |
| Ghanaians | 6.5 /100 | #228 | Tragic 20.8% |
| Australians | 6.1 /100 | #229 | Tragic 20.8% |
| Whites/Caucasians | 6.1 /100 | #230 | Tragic 20.8% |
| Immigrants | St. Vincent and the Grenadines | 6.0 /100 | #231 | Tragic 20.8% |
| Finns | 6.0 /100 | #232 | Tragic 20.8% |
| Immigrants | Denmark | 5.8 /100 | #233 | Tragic 20.8% |
| Welsh | 5.4 /100 | #234 | Tragic 20.8% |
| Immigrants | Uganda | 5.1 /100 | #235 | Tragic 20.8% |
| Okinawans | 4.9 /100 | #236 | Tragic 20.8% |
| Scottish | 4.5 /100 | #237 | Tragic 20.9% |
| Immigrants | Singapore | 4.4 /100 | #238 | Tragic 20.9% |
| Immigrants | Guatemala | 4.3 /100 | #239 | Tragic 20.9% |
| Luxembourgers | 4.2 /100 | #240 | Tragic 20.9% |
| Immigrants | Eritrea | 4.2 /100 | #241 | Tragic 20.9% |
| Israelis | 4.1 /100 | #242 | Tragic 20.9% |
| Marshallese | 3.4 /100 | #243 | Tragic 20.9% |
| Immigrants | Thailand | 3.4 /100 | #244 | Tragic 20.9% |
| Aleuts | 3.3 /100 | #245 | Tragic 20.9% |