Bahamian vs Norwegian Female Poverty Among 18-24 Year Olds
COMPARE
Bahamian
Norwegian
Female Poverty Among 18-24 Year Olds
Female Poverty Among 18-24 Year Olds Comparison
Bahamians
Norwegians
21.8%
FEMALE POVERTY AMONG 18-24 YEAR OLDS
0.1/ 100
METRIC RATING
276th/ 347
METRIC RANK
20.7%
FEMALE POVERTY AMONG 18-24 YEAR OLDS
7.3/ 100
METRIC RATING
225th/ 347
METRIC RANK
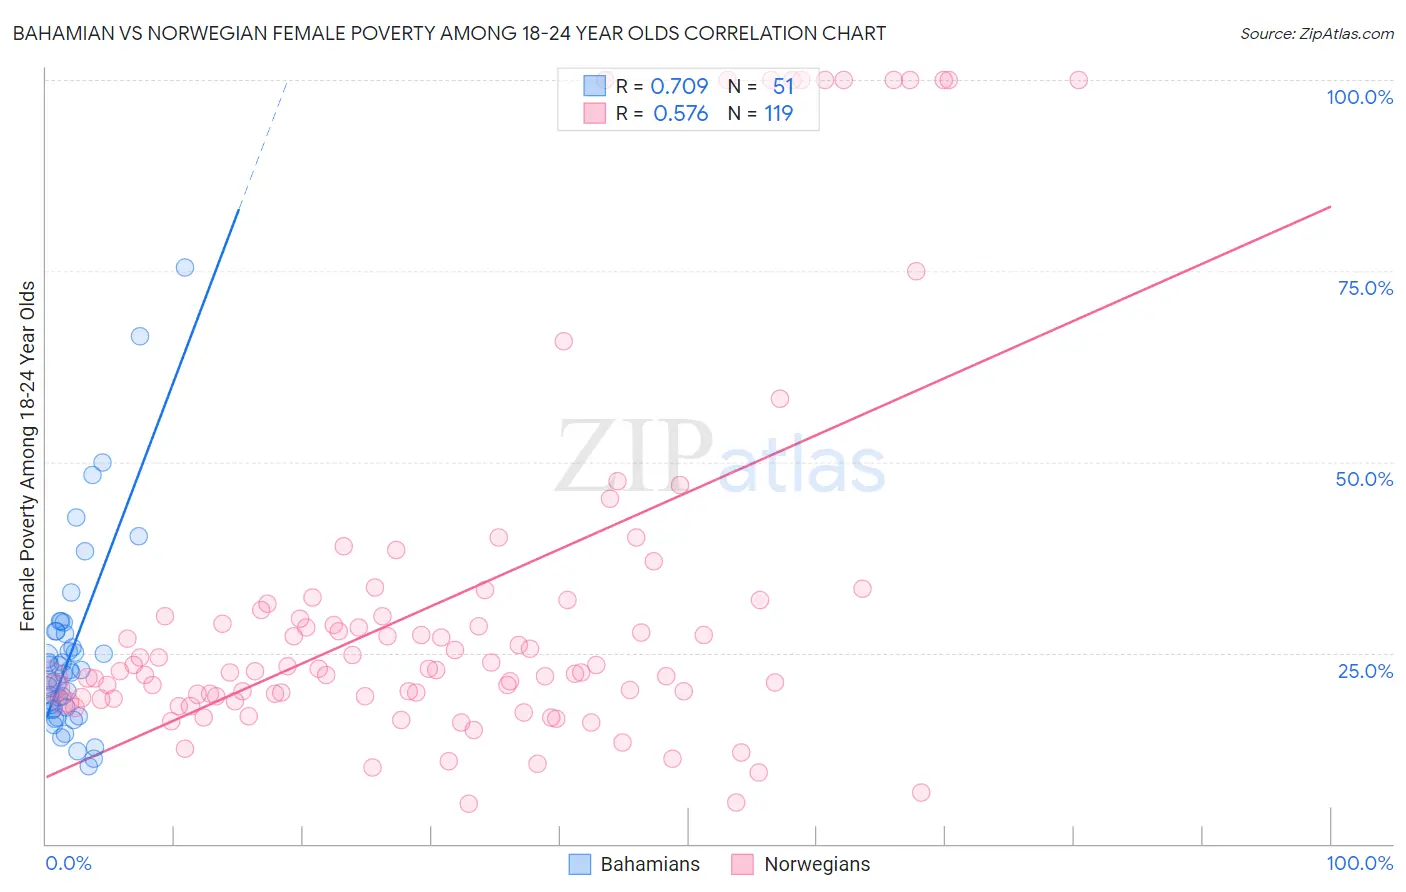
Bahamian vs Norwegian Female Poverty Among 18-24 Year Olds Correlation Chart
The statistical analysis conducted on geographies consisting of 111,859,293 people shows a strong positive correlation between the proportion of Bahamians and poverty level among females between the ages 18 and 24 in the United States with a correlation coefficient (R) of 0.709 and weighted average of 21.8%. Similarly, the statistical analysis conducted on geographies consisting of 505,664,525 people shows a substantial positive correlation between the proportion of Norwegians and poverty level among females between the ages 18 and 24 in the United States with a correlation coefficient (R) of 0.576 and weighted average of 20.7%, a difference of 5.1%.
Female Poverty Among 18-24 Year Olds Correlation Summary
| Measurement | Bahamian | Norwegian |
| Minimum | 10.1% | 5.2% |
| Maximum | 75.5% | 100.0% |
| Range | 65.4% | 94.8% |
| Mean | 25.1% | 31.9% |
| Median | 22.5% | 22.7% |
| Interquartile 25% (IQ1) | 17.7% | 19.1% |
| Interquartile 75% (IQ3) | 27.8% | 31.5% |
| Interquartile Range (IQR) | 10.1% | 12.4% |
| Standard Deviation (Sample) | 12.7% | 25.1% |
| Standard Deviation (Population) | 12.6% | 25.0% |
Similar Demographics by Female Poverty Among 18-24 Year Olds
Demographics Similar to Bahamians by Female Poverty Among 18-24 Year Olds
In terms of female poverty among 18-24 year olds, the demographic groups most similar to Bahamians are Immigrants from Bangladesh (21.8%, a difference of 0.020%), Immigrants from Honduras (21.8%, a difference of 0.060%), Immigrants from Switzerland (21.8%, a difference of 0.13%), Yaqui (21.9%, a difference of 0.39%), and New Zealander (21.7%, a difference of 0.45%).
| Demographics | Rating | Rank | Female Poverty Among 18-24 Year Olds |
| Celtics | 0.2 /100 | #269 | Tragic 21.6% |
| Mongolians | 0.2 /100 | #270 | Tragic 21.6% |
| Scotch-Irish | 0.2 /100 | #271 | Tragic 21.6% |
| Basques | 0.2 /100 | #272 | Tragic 21.7% |
| New Zealanders | 0.2 /100 | #273 | Tragic 21.7% |
| Immigrants | Honduras | 0.1 /100 | #274 | Tragic 21.8% |
| Immigrants | Bangladesh | 0.1 /100 | #275 | Tragic 21.8% |
| Bahamians | 0.1 /100 | #276 | Tragic 21.8% |
| Immigrants | Switzerland | 0.1 /100 | #277 | Tragic 21.8% |
| Yaqui | 0.1 /100 | #278 | Tragic 21.9% |
| Spanish Americans | 0.1 /100 | #279 | Tragic 21.9% |
| Immigrants | Dominica | 0.1 /100 | #280 | Tragic 21.9% |
| Immigrants | Dominican Republic | 0.1 /100 | #281 | Tragic 21.9% |
| Bermudans | 0.1 /100 | #282 | Tragic 21.9% |
| Sub-Saharan Africans | 0.0 /100 | #283 | Tragic 22.0% |
Demographics Similar to Norwegians by Female Poverty Among 18-24 Year Olds
In terms of female poverty among 18-24 year olds, the demographic groups most similar to Norwegians are Estonian (20.7%, a difference of 0.020%), Immigrants from Liberia (20.7%, a difference of 0.060%), Immigrants from Sweden (20.7%, a difference of 0.080%), French (20.7%, a difference of 0.11%), and Guatemalan (20.7%, a difference of 0.13%).
| Demographics | Rating | Rank | Female Poverty Among 18-24 Year Olds |
| Immigrants | Nepal | 9.6 /100 | #218 | Tragic 20.7% |
| Immigrants | Micronesia | 9.6 /100 | #219 | Tragic 20.7% |
| British | 9.4 /100 | #220 | Tragic 20.7% |
| Barbadians | 9.0 /100 | #221 | Tragic 20.7% |
| Guatemalans | 8.1 /100 | #222 | Tragic 20.7% |
| French | 7.9 /100 | #223 | Tragic 20.7% |
| Immigrants | Liberia | 7.6 /100 | #224 | Tragic 20.7% |
| Norwegians | 7.3 /100 | #225 | Tragic 20.7% |
| Estonians | 7.2 /100 | #226 | Tragic 20.7% |
| Immigrants | Sweden | 6.8 /100 | #227 | Tragic 20.7% |
| Ghanaians | 6.5 /100 | #228 | Tragic 20.8% |
| Australians | 6.1 /100 | #229 | Tragic 20.8% |
| Whites/Caucasians | 6.1 /100 | #230 | Tragic 20.8% |
| Immigrants | St. Vincent and the Grenadines | 6.0 /100 | #231 | Tragic 20.8% |
| Finns | 6.0 /100 | #232 | Tragic 20.8% |