Aleut vs Norwegian Unemployment Among Women with Children Under 18 years
COMPARE
Aleut
Norwegian
Unemployment Among Women with Children Under 18 years
Unemployment Among Women with Children Under 18 years Comparison
Aleuts
Norwegians
5.4%
UNEMPLOYMENT AMONG WOMEN WITH CHILDREN UNDER 18 YEARS
59.4/ 100
METRIC RATING
166th/ 347
METRIC RANK
4.4%
UNEMPLOYMENT AMONG WOMEN WITH CHILDREN UNDER 18 YEARS
100.0/ 100
METRIC RATING
1st/ 347
METRIC RANK
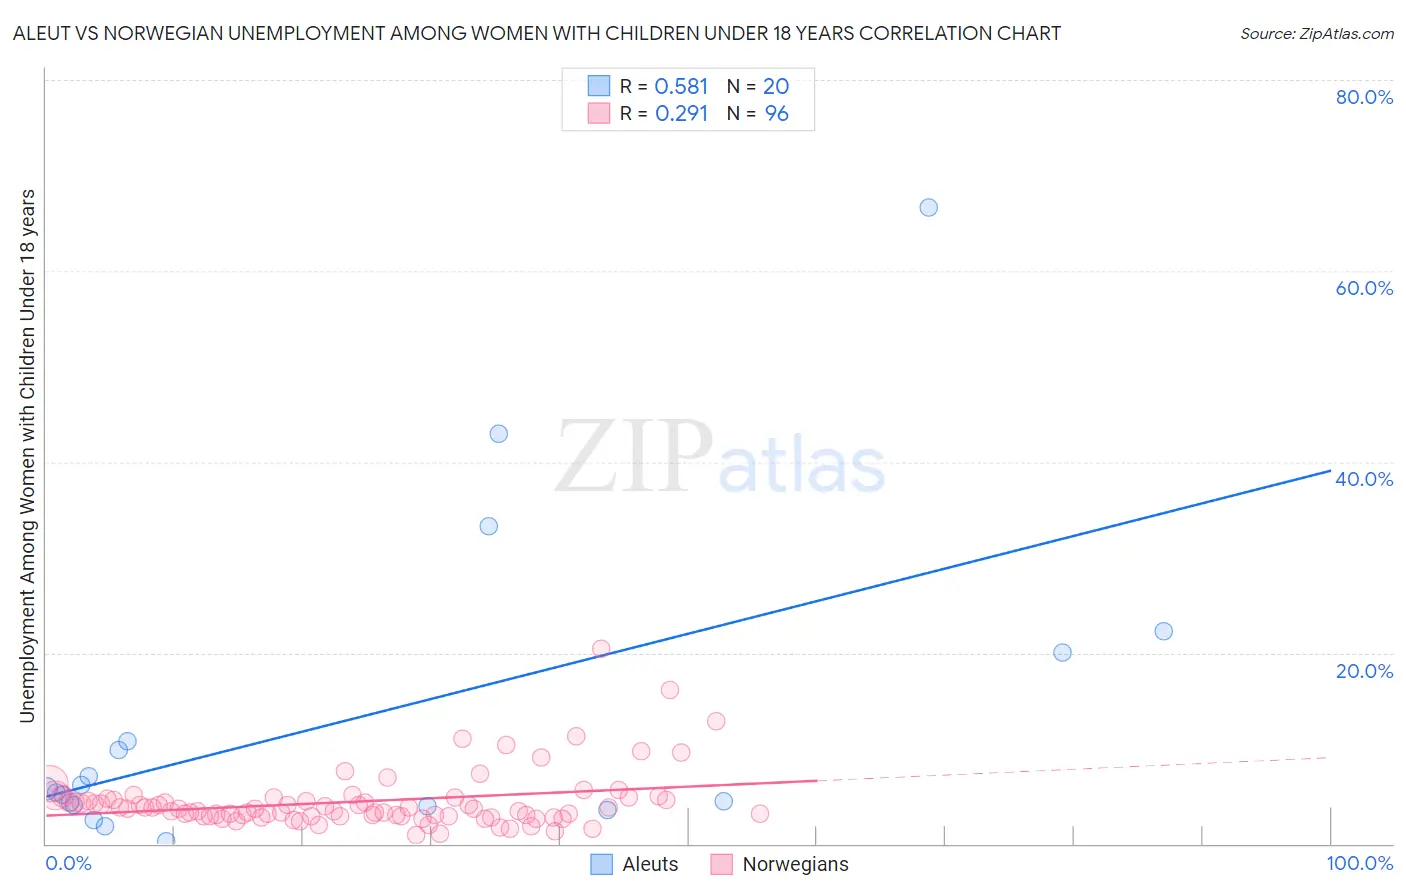
Aleut vs Norwegian Unemployment Among Women with Children Under 18 years Correlation Chart
The statistical analysis conducted on geographies consisting of 61,026,764 people shows a substantial positive correlation between the proportion of Aleuts and unemployment rate among women with children under the age of 18 in the United States with a correlation coefficient (R) of 0.581 and weighted average of 5.4%. Similarly, the statistical analysis conducted on geographies consisting of 488,214,220 people shows a weak positive correlation between the proportion of Norwegians and unemployment rate among women with children under the age of 18 in the United States with a correlation coefficient (R) of 0.291 and weighted average of 4.4%, a difference of 23.1%.
Unemployment Among Women with Children Under 18 years Correlation Summary
| Measurement | Aleut | Norwegian |
| Minimum | 0.20% | 0.86% |
| Maximum | 66.7% | 20.5% |
| Range | 66.5% | 19.6% |
| Mean | 13.0% | 4.4% |
| Median | 5.6% | 3.6% |
| Interquartile 25% (IQ1) | 4.0% | 2.9% |
| Interquartile 75% (IQ3) | 15.4% | 4.7% |
| Interquartile Range (IQR) | 11.4% | 1.8% |
| Standard Deviation (Sample) | 16.8% | 3.0% |
| Standard Deviation (Population) | 16.4% | 3.0% |
Similar Demographics by Unemployment Among Women with Children Under 18 years
Demographics Similar to Aleuts by Unemployment Among Women with Children Under 18 years
In terms of unemployment among women with children under 18 years, the demographic groups most similar to Aleuts are Immigrants from Denmark (5.4%, a difference of 0.10%), Tlingit-Haida (5.4%, a difference of 0.19%), Immigrants from Northern Africa (5.4%, a difference of 0.24%), Celtic (5.4%, a difference of 0.28%), and Immigrants from Thailand (5.4%, a difference of 0.30%).
| Demographics | Rating | Rank | Unemployment Among Women with Children Under 18 years |
| Chickasaw | 68.4 /100 | #159 | Good 5.4% |
| Afghans | 66.6 /100 | #160 | Good 5.4% |
| Immigrants | Iraq | 65.9 /100 | #161 | Good 5.4% |
| Immigrants | Saudi Arabia | 65.0 /100 | #162 | Good 5.4% |
| Lebanese | 64.7 /100 | #163 | Good 5.4% |
| Celtics | 63.0 /100 | #164 | Good 5.4% |
| Tlingit-Haida | 61.9 /100 | #165 | Good 5.4% |
| Aleuts | 59.4 /100 | #166 | Average 5.4% |
| Immigrants | Denmark | 58.0 /100 | #167 | Average 5.4% |
| Immigrants | Northern Africa | 56.1 /100 | #168 | Average 5.4% |
| Immigrants | Thailand | 55.3 /100 | #169 | Average 5.4% |
| Samoans | 54.1 /100 | #170 | Average 5.4% |
| Immigrants | Philippines | 53.1 /100 | #171 | Average 5.4% |
| Immigrants | Kazakhstan | 51.7 /100 | #172 | Average 5.4% |
| Immigrants | Eastern Africa | 51.3 /100 | #173 | Average 5.4% |
Demographics Similar to Norwegians by Unemployment Among Women with Children Under 18 years
In terms of unemployment among women with children under 18 years, the demographic groups most similar to Norwegians are Hmong (4.5%, a difference of 2.3%), Danish (4.5%, a difference of 3.3%), Swedish (4.7%, a difference of 6.0%), Tongan (4.7%, a difference of 6.1%), and Immigrants from Taiwan (4.7%, a difference of 6.2%).
| Demographics | Rating | Rank | Unemployment Among Women with Children Under 18 years |
| Norwegians | 100.0 /100 | #1 | Exceptional 4.4% |
| Hmong | 100.0 /100 | #2 | Exceptional 4.5% |
| Danes | 100.0 /100 | #3 | Exceptional 4.5% |
| Swedes | 100.0 /100 | #4 | Exceptional 4.7% |
| Tongans | 100.0 /100 | #5 | Exceptional 4.7% |
| Immigrants | Taiwan | 100.0 /100 | #6 | Exceptional 4.7% |
| Immigrants | India | 100.0 /100 | #7 | Exceptional 4.7% |
| Immigrants | Hong Kong | 100.0 /100 | #8 | Exceptional 4.7% |
| Okinawans | 99.9 /100 | #9 | Exceptional 4.7% |
| Czechs | 99.9 /100 | #10 | Exceptional 4.7% |
| Filipinos | 99.9 /100 | #11 | Exceptional 4.8% |
| Scandinavians | 99.9 /100 | #12 | Exceptional 4.8% |
| Bulgarians | 99.9 /100 | #13 | Exceptional 4.8% |
| Cambodians | 99.9 /100 | #14 | Exceptional 4.8% |
| Thais | 99.8 /100 | #15 | Exceptional 4.8% |