Czechoslovakian vs Norwegian Female Poverty Among 18-24 Year Olds
COMPARE
Czechoslovakian
Norwegian
Female Poverty Among 18-24 Year Olds
Female Poverty Among 18-24 Year Olds Comparison
Czechoslovakians
Norwegians
20.0%
FEMALE POVERTY AMONG 18-24 YEAR OLDS
61.8/ 100
METRIC RATING
167th/ 347
METRIC RANK
20.7%
FEMALE POVERTY AMONG 18-24 YEAR OLDS
7.3/ 100
METRIC RATING
225th/ 347
METRIC RANK
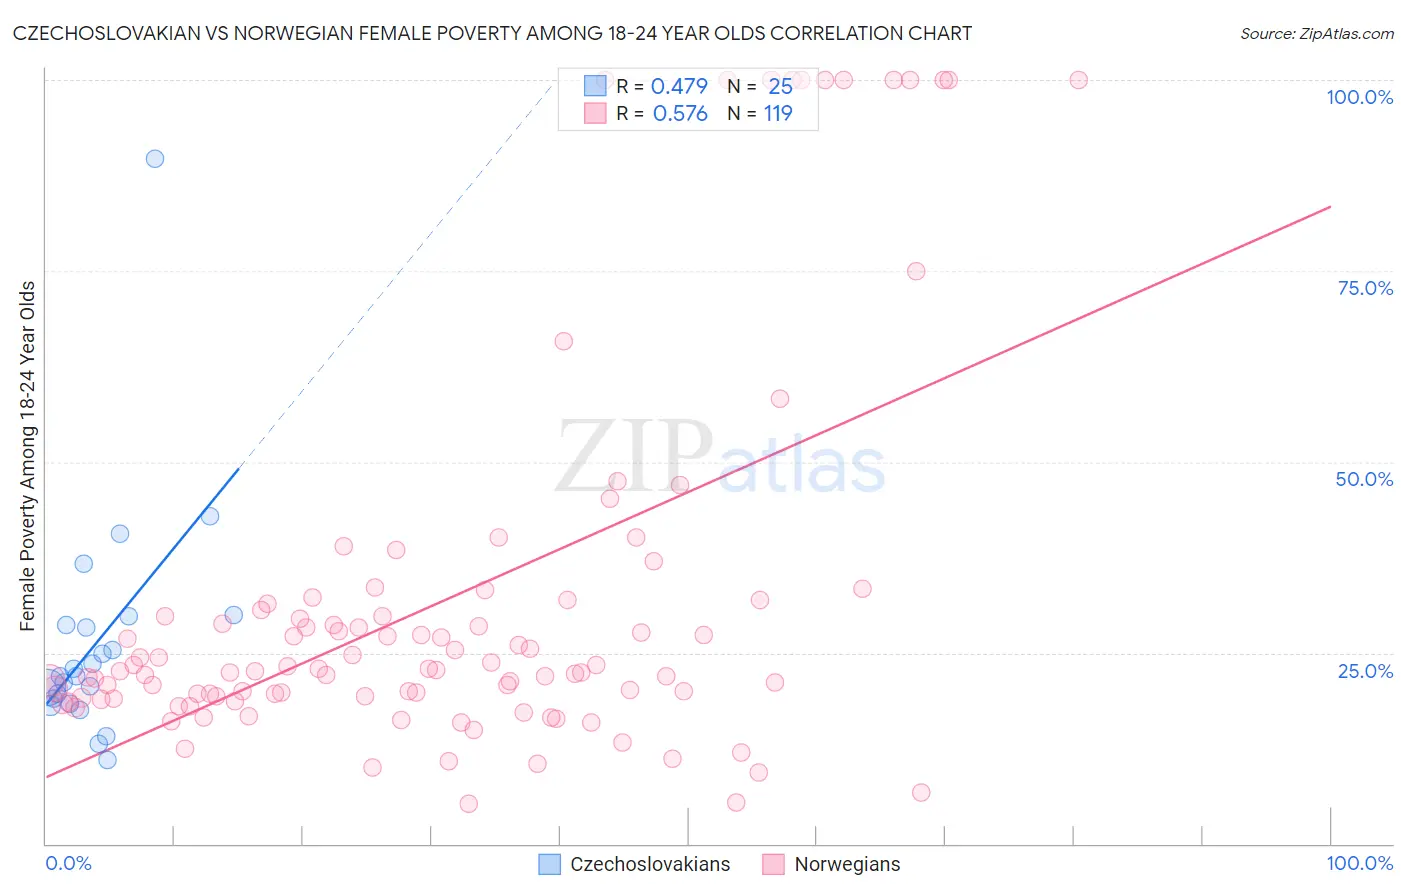
Czechoslovakian vs Norwegian Female Poverty Among 18-24 Year Olds Correlation Chart
The statistical analysis conducted on geographies consisting of 357,520,736 people shows a moderate positive correlation between the proportion of Czechoslovakians and poverty level among females between the ages 18 and 24 in the United States with a correlation coefficient (R) of 0.479 and weighted average of 20.0%. Similarly, the statistical analysis conducted on geographies consisting of 505,664,525 people shows a substantial positive correlation between the proportion of Norwegians and poverty level among females between the ages 18 and 24 in the United States with a correlation coefficient (R) of 0.576 and weighted average of 20.7%, a difference of 3.7%.
Female Poverty Among 18-24 Year Olds Correlation Summary
| Measurement | Czechoslovakian | Norwegian |
| Minimum | 11.0% | 5.2% |
| Maximum | 89.7% | 100.0% |
| Range | 78.7% | 94.8% |
| Mean | 26.4% | 31.9% |
| Median | 22.0% | 22.7% |
| Interquartile 25% (IQ1) | 18.6% | 19.1% |
| Interquartile 75% (IQ3) | 29.3% | 31.5% |
| Interquartile Range (IQR) | 10.6% | 12.4% |
| Standard Deviation (Sample) | 15.4% | 25.1% |
| Standard Deviation (Population) | 15.1% | 25.0% |
Similar Demographics by Female Poverty Among 18-24 Year Olds
Demographics Similar to Czechoslovakians by Female Poverty Among 18-24 Year Olds
In terms of female poverty among 18-24 year olds, the demographic groups most similar to Czechoslovakians are Fijian (20.0%, a difference of 0.14%), Hmong (20.0%, a difference of 0.32%), Iranian (20.1%, a difference of 0.36%), Immigrants from Nigeria (20.1%, a difference of 0.38%), and Belgian (19.9%, a difference of 0.40%).
| Demographics | Rating | Rank | Female Poverty Among 18-24 Year Olds |
| Pakistanis | 74.1 /100 | #160 | Good 19.8% |
| Immigrants | Belize | 74.1 /100 | #161 | Good 19.8% |
| French Canadians | 73.0 /100 | #162 | Good 19.9% |
| Malaysians | 72.7 /100 | #163 | Good 19.9% |
| Central Americans | 70.0 /100 | #164 | Good 19.9% |
| Eastern Europeans | 69.3 /100 | #165 | Good 19.9% |
| Belgians | 69.1 /100 | #166 | Good 19.9% |
| Czechoslovakians | 61.8 /100 | #167 | Good 20.0% |
| Fijians | 59.1 /100 | #168 | Average 20.0% |
| Hmong | 55.4 /100 | #169 | Average 20.0% |
| Iranians | 54.7 /100 | #170 | Average 20.1% |
| Immigrants | Nigeria | 54.3 /100 | #171 | Average 20.1% |
| Belizeans | 52.0 /100 | #172 | Average 20.1% |
| Irish | 50.0 /100 | #173 | Average 20.1% |
| Swedes | 50.0 /100 | #174 | Average 20.1% |
Demographics Similar to Norwegians by Female Poverty Among 18-24 Year Olds
In terms of female poverty among 18-24 year olds, the demographic groups most similar to Norwegians are Estonian (20.7%, a difference of 0.020%), Immigrants from Liberia (20.7%, a difference of 0.060%), Immigrants from Sweden (20.7%, a difference of 0.080%), French (20.7%, a difference of 0.11%), and Guatemalan (20.7%, a difference of 0.13%).
| Demographics | Rating | Rank | Female Poverty Among 18-24 Year Olds |
| Immigrants | Nepal | 9.6 /100 | #218 | Tragic 20.7% |
| Immigrants | Micronesia | 9.6 /100 | #219 | Tragic 20.7% |
| British | 9.4 /100 | #220 | Tragic 20.7% |
| Barbadians | 9.0 /100 | #221 | Tragic 20.7% |
| Guatemalans | 8.1 /100 | #222 | Tragic 20.7% |
| French | 7.9 /100 | #223 | Tragic 20.7% |
| Immigrants | Liberia | 7.6 /100 | #224 | Tragic 20.7% |
| Norwegians | 7.3 /100 | #225 | Tragic 20.7% |
| Estonians | 7.2 /100 | #226 | Tragic 20.7% |
| Immigrants | Sweden | 6.8 /100 | #227 | Tragic 20.7% |
| Ghanaians | 6.5 /100 | #228 | Tragic 20.8% |
| Australians | 6.1 /100 | #229 | Tragic 20.8% |
| Whites/Caucasians | 6.1 /100 | #230 | Tragic 20.8% |
| Immigrants | St. Vincent and the Grenadines | 6.0 /100 | #231 | Tragic 20.8% |
| Finns | 6.0 /100 | #232 | Tragic 20.8% |