Aleut vs Black/African American Child Poverty Among Boys Under 16
COMPARE
Aleut
Black/African American
Child Poverty Among Boys Under 16
Child Poverty Among Boys Under 16 Comparison
Aleuts
Blacks/African Americans
17.7%
CHILD POVERTY AMONG BOYS UNDER 16
6.6/ 100
METRIC RATING
212th/ 347
METRIC RANK
24.5%
CHILD POVERTY AMONG BOYS UNDER 16
0.0/ 100
METRIC RATING
334th/ 347
METRIC RANK
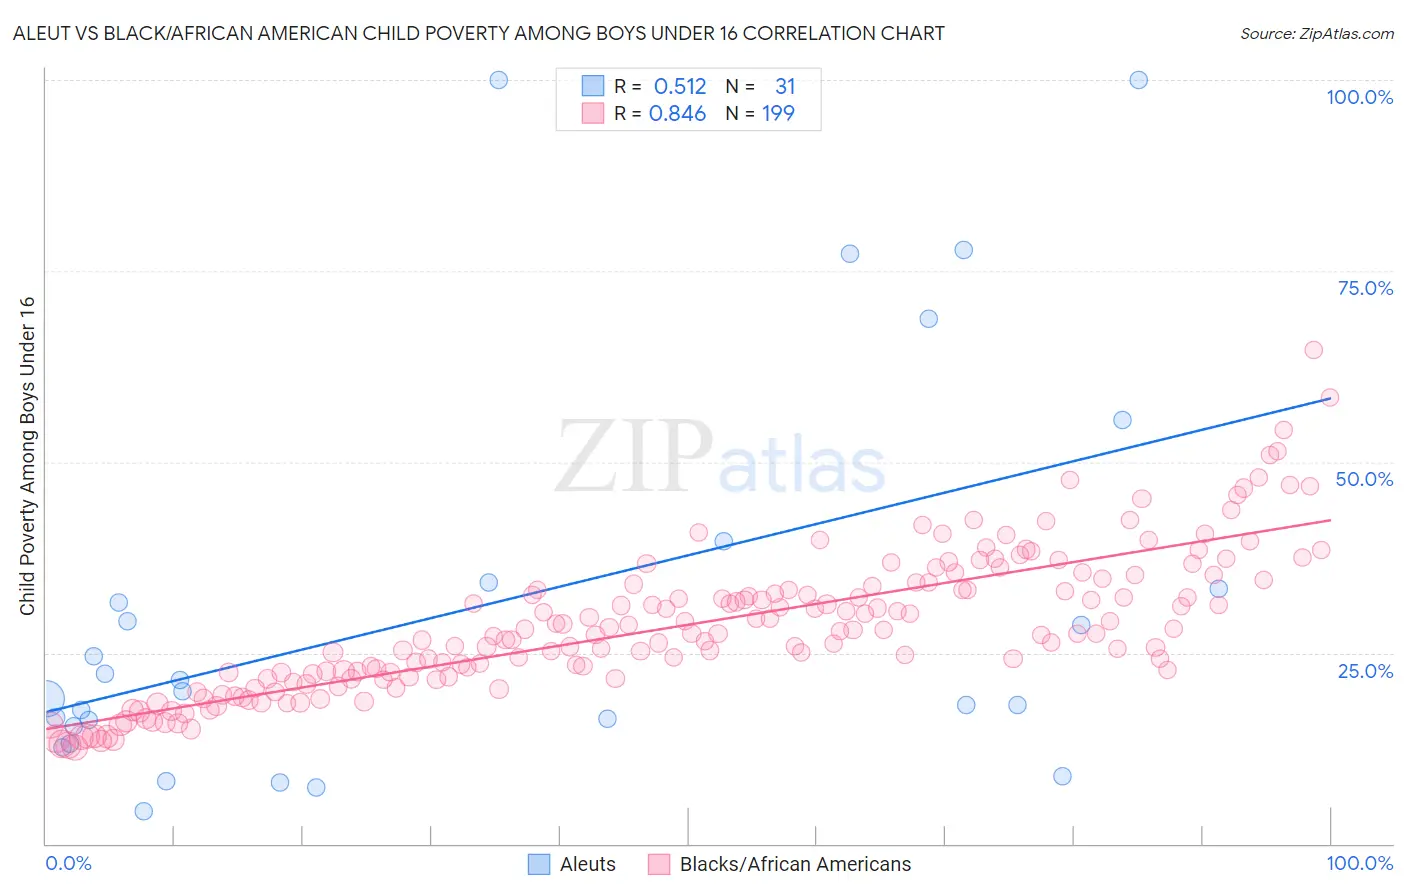
Aleut vs Black/African American Child Poverty Among Boys Under 16 Correlation Chart
The statistical analysis conducted on geographies consisting of 61,373,672 people shows a substantial positive correlation between the proportion of Aleuts and poverty level among boys under the age of 16 in the United States with a correlation coefficient (R) of 0.512 and weighted average of 17.7%. Similarly, the statistical analysis conducted on geographies consisting of 548,051,875 people shows a very strong positive correlation between the proportion of Blacks/African Americans and poverty level among boys under the age of 16 in the United States with a correlation coefficient (R) of 0.846 and weighted average of 24.5%, a difference of 39.0%.
Child Poverty Among Boys Under 16 Correlation Summary
| Measurement | Aleut | Black/African American |
| Minimum | 4.2% | 12.5% |
| Maximum | 100.0% | 64.6% |
| Range | 95.8% | 52.1% |
| Mean | 31.1% | 28.6% |
| Median | 20.0% | 27.6% |
| Interquartile 25% (IQ1) | 15.3% | 21.9% |
| Interquartile 75% (IQ3) | 34.3% | 34.0% |
| Interquartile Range (IQR) | 19.0% | 12.1% |
| Standard Deviation (Sample) | 26.7% | 9.3% |
| Standard Deviation (Population) | 26.2% | 9.3% |
Similar Demographics by Child Poverty Among Boys Under 16
Demographics Similar to Aleuts by Child Poverty Among Boys Under 16
In terms of child poverty among boys under 16, the demographic groups most similar to Aleuts are Immigrants (17.6%, a difference of 0.050%), Immigrants from Armenia (17.6%, a difference of 0.11%), Immigrants from Eastern Africa (17.7%, a difference of 0.28%), Panamanian (17.7%, a difference of 0.28%), and Alaskan Athabascan (17.6%, a difference of 0.29%).
| Demographics | Rating | Rank | Child Poverty Among Boys Under 16 |
| Immigrants | Portugal | 11.2 /100 | #205 | Poor 17.4% |
| German Russians | 10.9 /100 | #206 | Poor 17.4% |
| Immigrants | Thailand | 8.2 /100 | #207 | Tragic 17.5% |
| Malaysians | 7.6 /100 | #208 | Tragic 17.6% |
| Alaskan Athabascans | 7.3 /100 | #209 | Tragic 17.6% |
| Immigrants | Armenia | 6.8 /100 | #210 | Tragic 17.6% |
| Immigrants | Immigrants | 6.7 /100 | #211 | Tragic 17.6% |
| Aleuts | 6.6 /100 | #212 | Tragic 17.7% |
| Immigrants | Eastern Africa | 6.0 /100 | #213 | Tragic 17.7% |
| Panamanians | 5.9 /100 | #214 | Tragic 17.7% |
| Osage | 5.8 /100 | #215 | Tragic 17.7% |
| Moroccans | 5.6 /100 | #216 | Tragic 17.7% |
| Japanese | 5.5 /100 | #217 | Tragic 17.7% |
| Iraqis | 5.5 /100 | #218 | Tragic 17.7% |
| Sierra Leoneans | 5.3 /100 | #219 | Tragic 17.8% |
Demographics Similar to Blacks/African Americans by Child Poverty Among Boys Under 16
In terms of child poverty among boys under 16, the demographic groups most similar to Blacks/African Americans are Apache (24.5%, a difference of 0.12%), Immigrants from Dominican Republic (24.3%, a difference of 0.84%), Yup'ik (24.7%, a difference of 0.85%), Dominican (24.2%, a difference of 1.4%), and Colville (24.1%, a difference of 1.8%).
| Demographics | Rating | Rank | Child Poverty Among Boys Under 16 |
| Immigrants | Honduras | 0.0 /100 | #327 | Tragic 22.8% |
| Pueblo | 0.0 /100 | #328 | Tragic 23.5% |
| Natives/Alaskans | 0.0 /100 | #329 | Tragic 24.0% |
| Colville | 0.0 /100 | #330 | Tragic 24.1% |
| Dominicans | 0.0 /100 | #331 | Tragic 24.2% |
| Immigrants | Dominican Republic | 0.0 /100 | #332 | Tragic 24.3% |
| Apache | 0.0 /100 | #333 | Tragic 24.5% |
| Blacks/African Americans | 0.0 /100 | #334 | Tragic 24.5% |
| Yup'ik | 0.0 /100 | #335 | Tragic 24.7% |
| Sioux | 0.0 /100 | #336 | Tragic 25.3% |
| Cheyenne | 0.0 /100 | #337 | Tragic 25.8% |
| Hopi | 0.0 /100 | #338 | Tragic 25.9% |
| Houma | 0.0 /100 | #339 | Tragic 26.2% |
| Crow | 0.0 /100 | #340 | Tragic 26.3% |
| Immigrants | Yemen | 0.0 /100 | #341 | Tragic 28.9% |