Aleut vs Marshallese Child Poverty Among Boys Under 16
COMPARE
Aleut
Marshallese
Child Poverty Among Boys Under 16
Child Poverty Among Boys Under 16 Comparison
Aleuts
Marshallese
17.7%
CHILD POVERTY AMONG BOYS UNDER 16
6.6/ 100
METRIC RATING
212th/ 347
METRIC RANK
18.4%
CHILD POVERTY AMONG BOYS UNDER 16
1.3/ 100
METRIC RATING
232nd/ 347
METRIC RANK
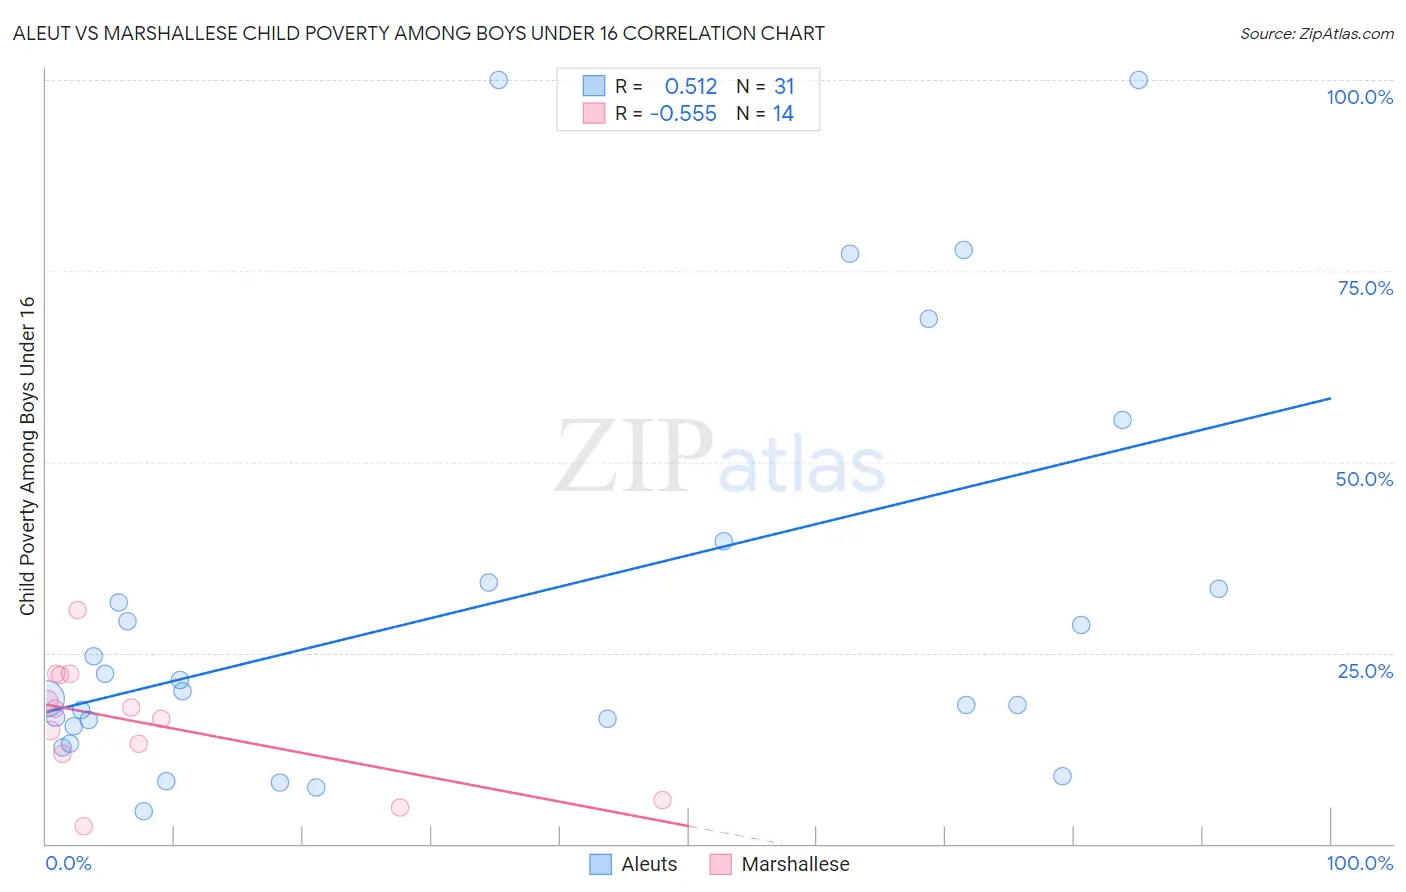
Aleut vs Marshallese Child Poverty Among Boys Under 16 Correlation Chart
The statistical analysis conducted on geographies consisting of 61,373,672 people shows a substantial positive correlation between the proportion of Aleuts and poverty level among boys under the age of 16 in the United States with a correlation coefficient (R) of 0.512 and weighted average of 17.7%. Similarly, the statistical analysis conducted on geographies consisting of 14,730,412 people shows a substantial negative correlation between the proportion of Marshallese and poverty level among boys under the age of 16 in the United States with a correlation coefficient (R) of -0.555 and weighted average of 18.4%, a difference of 4.3%.
Child Poverty Among Boys Under 16 Correlation Summary
| Measurement | Aleut | Marshallese |
| Minimum | 4.2% | 2.3% |
| Maximum | 100.0% | 30.6% |
| Range | 95.8% | 28.3% |
| Mean | 31.1% | 15.7% |
| Median | 20.0% | 17.1% |
| Interquartile 25% (IQ1) | 15.3% | 11.8% |
| Interquartile 75% (IQ3) | 34.3% | 22.2% |
| Interquartile Range (IQR) | 19.0% | 10.3% |
| Standard Deviation (Sample) | 26.7% | 7.8% |
| Standard Deviation (Population) | 26.2% | 7.5% |
Demographics Similar to Aleuts and Marshallese by Child Poverty Among Boys Under 16
In terms of child poverty among boys under 16, the demographic groups most similar to Aleuts are Immigrants from Eastern Africa (17.7%, a difference of 0.28%), Panamanian (17.7%, a difference of 0.28%), Osage (17.7%, a difference of 0.35%), Moroccan (17.7%, a difference of 0.44%), and Japanese (17.7%, a difference of 0.48%). Similarly, the demographic groups most similar to Marshallese are Nicaraguan (18.4%, a difference of 0.20%), Immigrants from Micronesia (18.3%, a difference of 0.73%), Fijian (18.3%, a difference of 0.73%), Nonimmigrants (18.2%, a difference of 1.3%), and Bermudan (18.1%, a difference of 1.6%).
| Demographics | Rating | Rank | Child Poverty Among Boys Under 16 |
| Aleuts | 6.6 /100 | #212 | Tragic 17.7% |
| Immigrants | Eastern Africa | 6.0 /100 | #213 | Tragic 17.7% |
| Panamanians | 5.9 /100 | #214 | Tragic 17.7% |
| Osage | 5.8 /100 | #215 | Tragic 17.7% |
| Moroccans | 5.6 /100 | #216 | Tragic 17.7% |
| Japanese | 5.5 /100 | #217 | Tragic 17.7% |
| Iraqis | 5.5 /100 | #218 | Tragic 17.7% |
| Sierra Leoneans | 5.3 /100 | #219 | Tragic 17.8% |
| Immigrants | Cambodia | 5.1 /100 | #220 | Tragic 17.8% |
| Immigrants | Panama | 4.3 /100 | #221 | Tragic 17.9% |
| Pennsylvania Germans | 3.9 /100 | #222 | Tragic 17.9% |
| Cubans | 3.8 /100 | #223 | Tragic 17.9% |
| Nepalese | 3.2 /100 | #224 | Tragic 18.0% |
| Inupiat | 2.7 /100 | #225 | Tragic 18.1% |
| Immigrants | Africa | 2.6 /100 | #226 | Tragic 18.1% |
| Bermudans | 2.5 /100 | #227 | Tragic 18.1% |
| Immigrants | Nonimmigrants | 2.2 /100 | #228 | Tragic 18.2% |
| Immigrants | Micronesia | 1.8 /100 | #229 | Tragic 18.3% |
| Fijians | 1.8 /100 | #230 | Tragic 18.3% |
| Nicaraguans | 1.4 /100 | #231 | Tragic 18.4% |
| Marshallese | 1.3 /100 | #232 | Tragic 18.4% |